Fig. 12.
Download original image
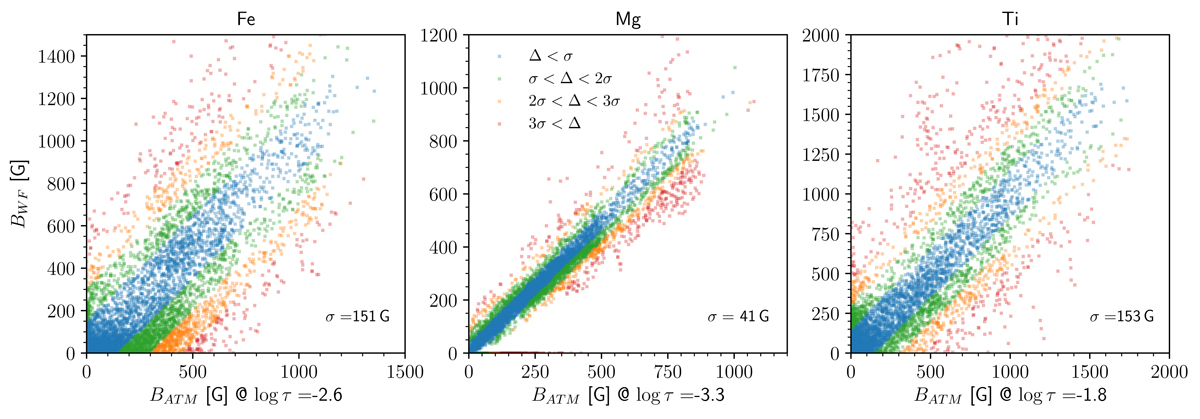
Comparison of the weak-field and the MURaM cube LOS magnetic field at the height of formation for each line. We note the different ranges of magnetic field values on each panel. Each panel contains the standard deviation of the differences BWF − BATM. Results are from the MURaM cube with the 100 G magnetic field at the bottom boundary. Color-coding is the same as in Fig. 11.
Current usage metrics show cumulative count of Article Views (full-text article views including HTML views, PDF and ePub downloads, according to the available data) and Abstracts Views on Vision4Press platform.
Data correspond to usage on the plateform after 2015. The current usage metrics is available 48-96 hours after online publication and is updated daily on week days.
Initial download of the metrics may take a while.