Open Access
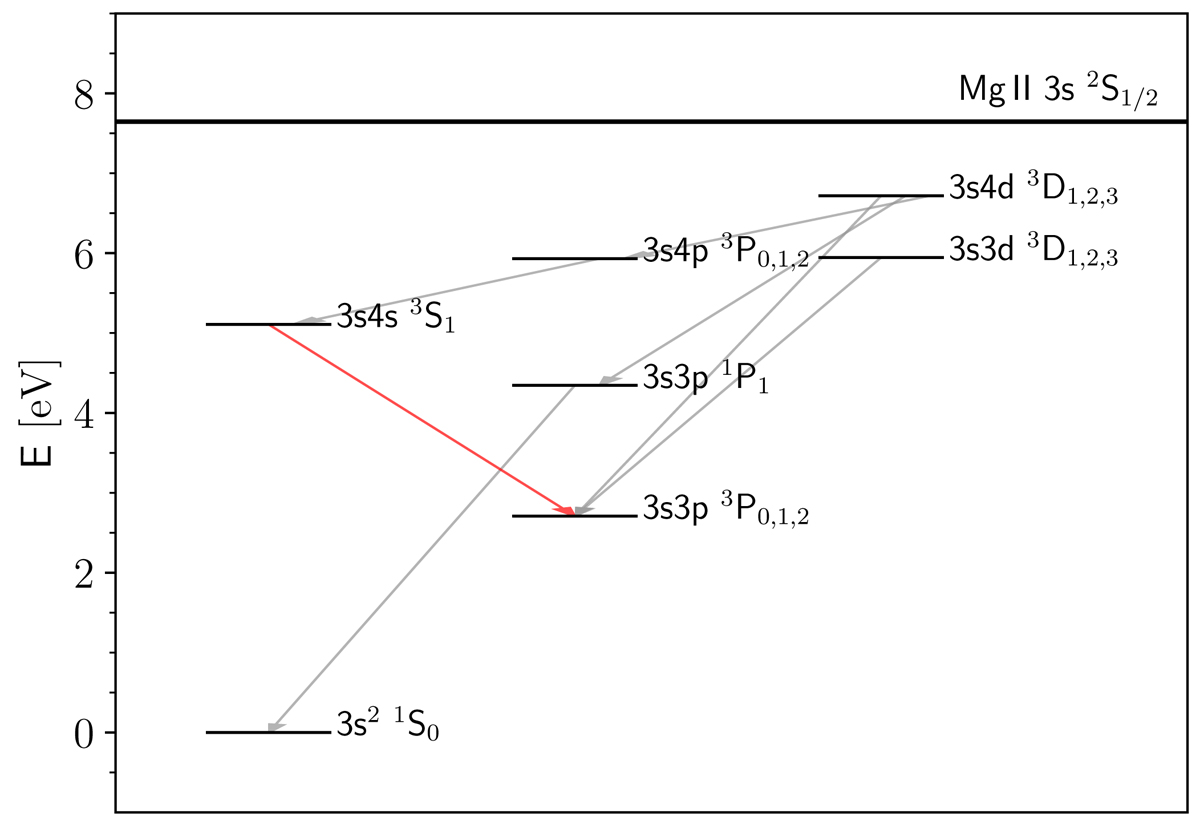
Fig. 1.
Download original image
Schematic term diagram of the 12-level Mg I atomic model. Red line denotes the transition in which the Mg I b lines are formed. Full lines represent the bound-bound transitions. From each bound level, we have a bound-free transition.
Current usage metrics show cumulative count of Article Views (full-text article views including HTML views, PDF and ePub downloads, according to the available data) and Abstracts Views on Vision4Press platform.
Data correspond to usage on the plateform after 2015. The current usage metrics is available 48-96 hours after online publication and is updated daily on week days.
Initial download of the metrics may take a while.