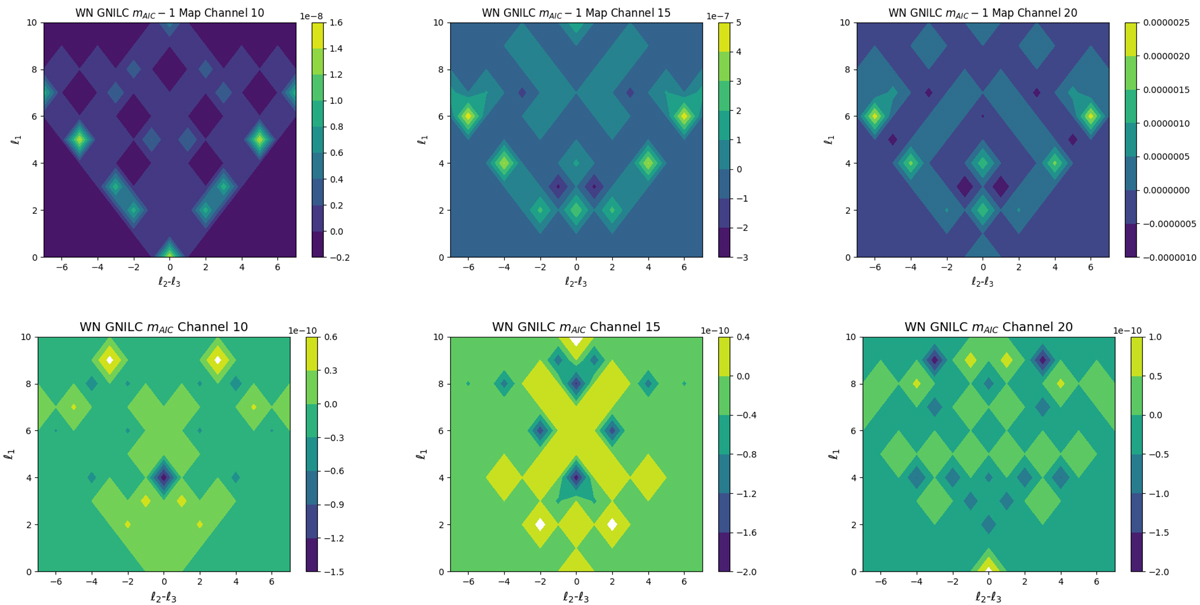
Fig. 14.
Download original image
Contour charts for the considered configurations of the bispectrum (where ℓ1 + ℓ2 + ℓ3 = 30) in three different channels: 10 (first column), 15 (second column), and 20 (third column). Each line is related to each case analyzed: GNILC output using mAIC − 1 (first row) and GNILC output using mAIC (second row). A very similar pattern arises from the results with mAIC − 1 and the first row for the measurements with the input foregrounds in Fig. 13. These patterns are similar, albeit with a much smaller amplitude, which indicates a severe reduction of foreground levels, but not a complete removal, which is directly identified in our analysis.
Current usage metrics show cumulative count of Article Views (full-text article views including HTML views, PDF and ePub downloads, according to the available data) and Abstracts Views on Vision4Press platform.
Data correspond to usage on the plateform after 2015. The current usage metrics is available 48-96 hours after online publication and is updated daily on week days.
Initial download of the metrics may take a while.