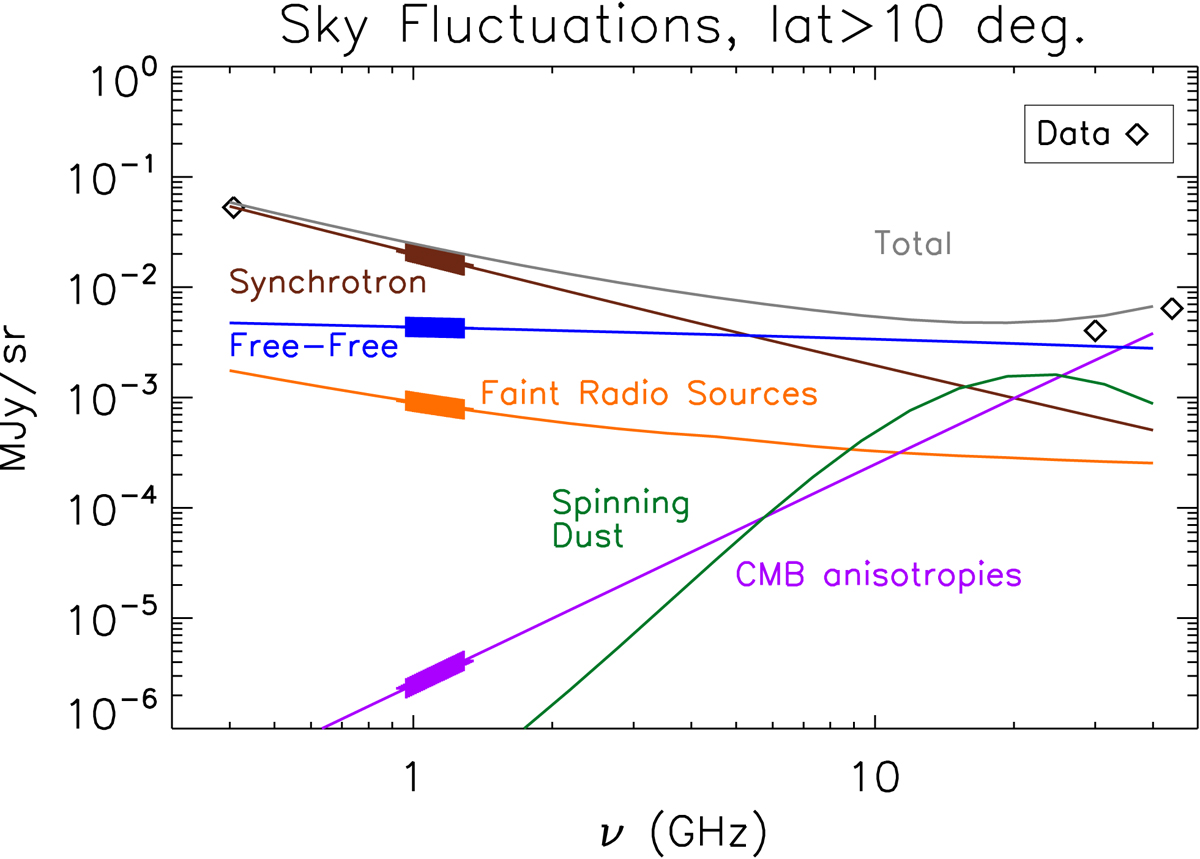
Fig. 1.
Download original image
Frequency scaling of the main foreground components simulated with the PSM. The various curves display the standard deviation of the maps of the various components as a function of frequency, at an angular resolution of 40′, and at galactic latitudes greater than 10°. The general shapes of the curves illustrate the average frequency scaling, while the relative amplitudes in the BINGO frequency range show the relative importance of the various components for the detection of 21 cm fluctuations by BINGO. The data points are from the 408 MHz map of Remazeilles et al. (2015), and the 28.4 and 44.1 GHz maps of the LFI instrument on board the Planck satellite.
Current usage metrics show cumulative count of Article Views (full-text article views including HTML views, PDF and ePub downloads, according to the available data) and Abstracts Views on Vision4Press platform.
Data correspond to usage on the plateform after 2015. The current usage metrics is available 48-96 hours after online publication and is updated daily on week days.
Initial download of the metrics may take a while.