Fig. 4
Download original image
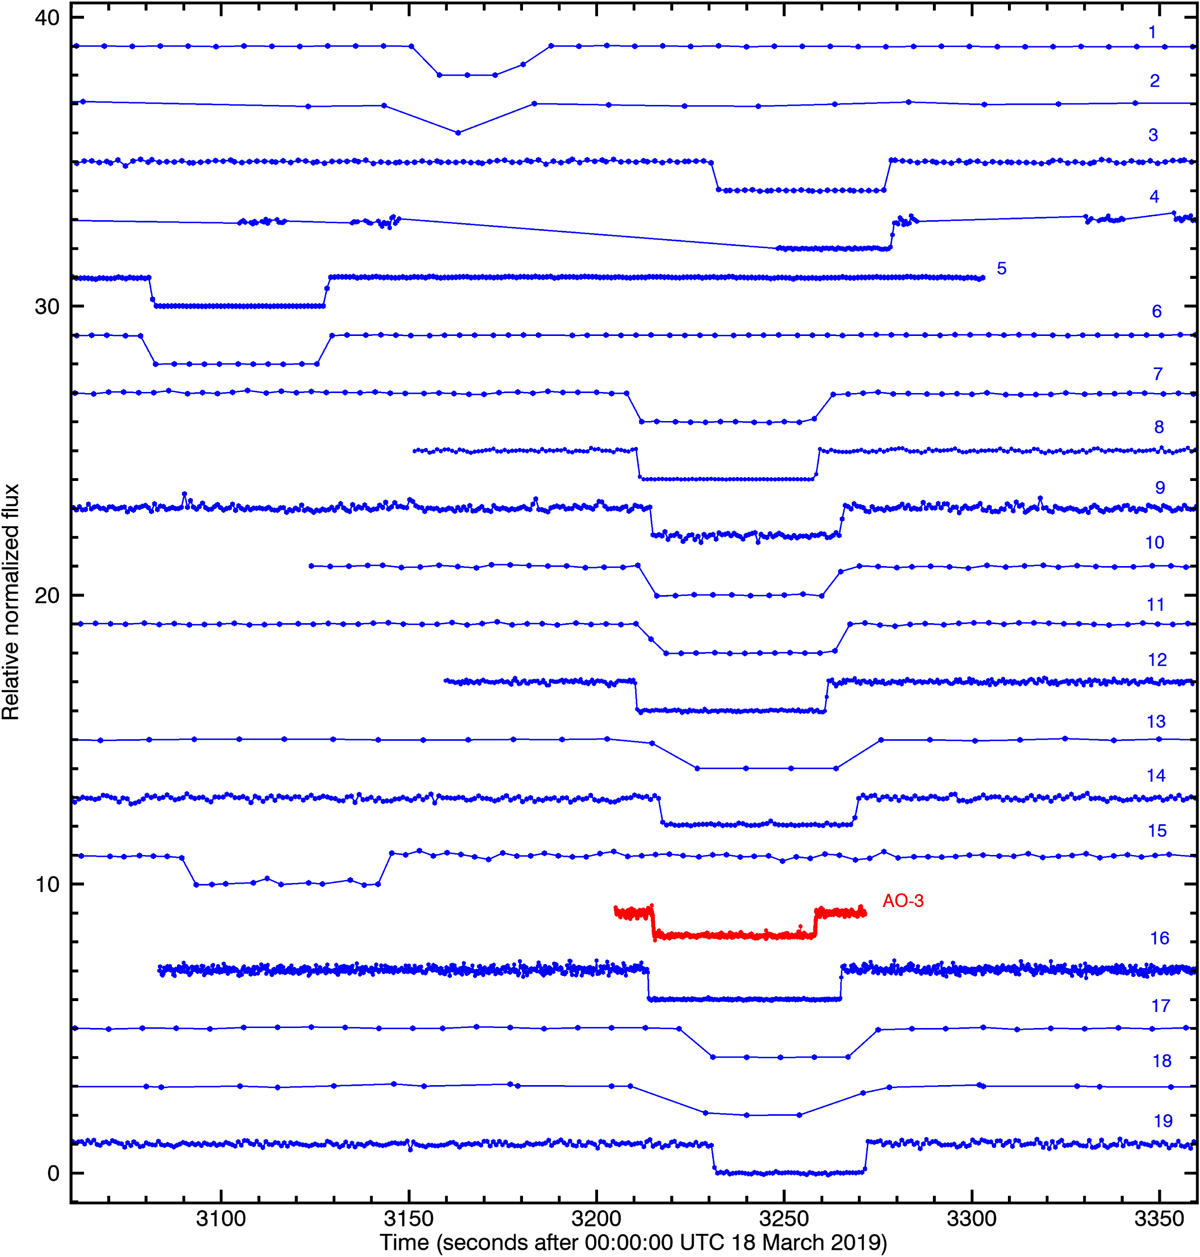
Stellar occultation light curves (normalized flux versus time) from the 21 positive detections, as presented in Table A.1. Each individual measurement is indicated with a dot, with these measurements connected by a solid line for clarity. The light curves are shifted in flux for a better viewing and are presented from top to bottom with respect to their distance to the center of the predicted shadow path, from west to east. Flux uncertainties are not shown in order to avoid an unreadable plot (the standard deviation of the measurements are indicated in Table A.1). Chord #18 is the combination of two light curves obtained from the same site (Galati Observatory, Romania) with two telescopes of 40-cm and 20-cm, respectively. The light curve in red (AO-3) was not used to obtain the limb fit, it has been shifted in time to properly appear in this plot because the time information of this chord was missed.
Current usage metrics show cumulative count of Article Views (full-text article views including HTML views, PDF and ePub downloads, according to the available data) and Abstracts Views on Vision4Press platform.
Data correspond to usage on the plateform after 2015. The current usage metrics is available 48-96 hours after online publication and is updated daily on week days.
Initial download of the metrics may take a while.