Fig. 13.
Download original image
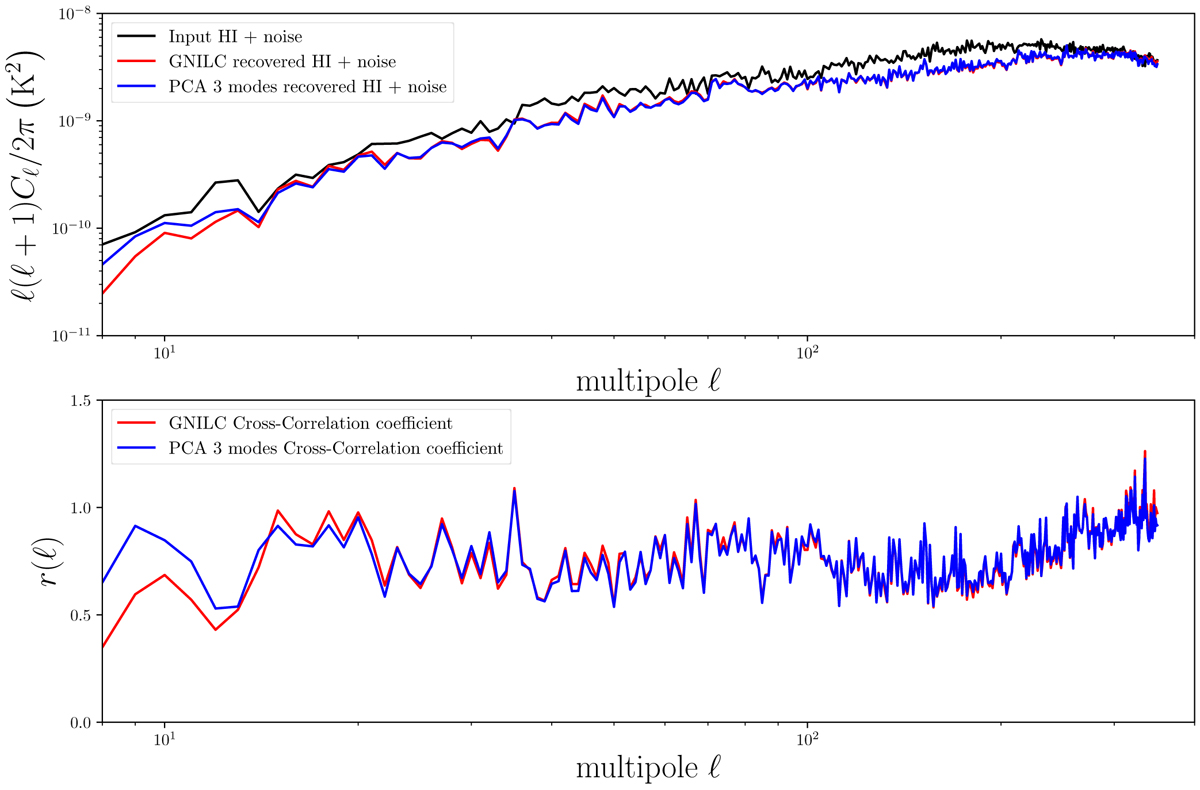
Component separation results using the simulation pipeline. Top: angular power spectra for the input H I plus noise signal (black), the GNILC recovered H I plus noise signal (red), and the PCA recovered H I plus noise signal with three modes removed (blue) at ≈1.1 GHz. For this particular channel and configuration (double-rectangular, 28 feeds, one-year observation time, and β = 0.25), NRec (GNILC) equals 21.43%. Bottom: cross-correlation coefficient r(ℓ) among the recovered signals (GNILC and PCA) and the input signal.
Current usage metrics show cumulative count of Article Views (full-text article views including HTML views, PDF and ePub downloads, according to the available data) and Abstracts Views on Vision4Press platform.
Data correspond to usage on the plateform after 2015. The current usage metrics is available 48-96 hours after online publication and is updated daily on week days.
Initial download of the metrics may take a while.