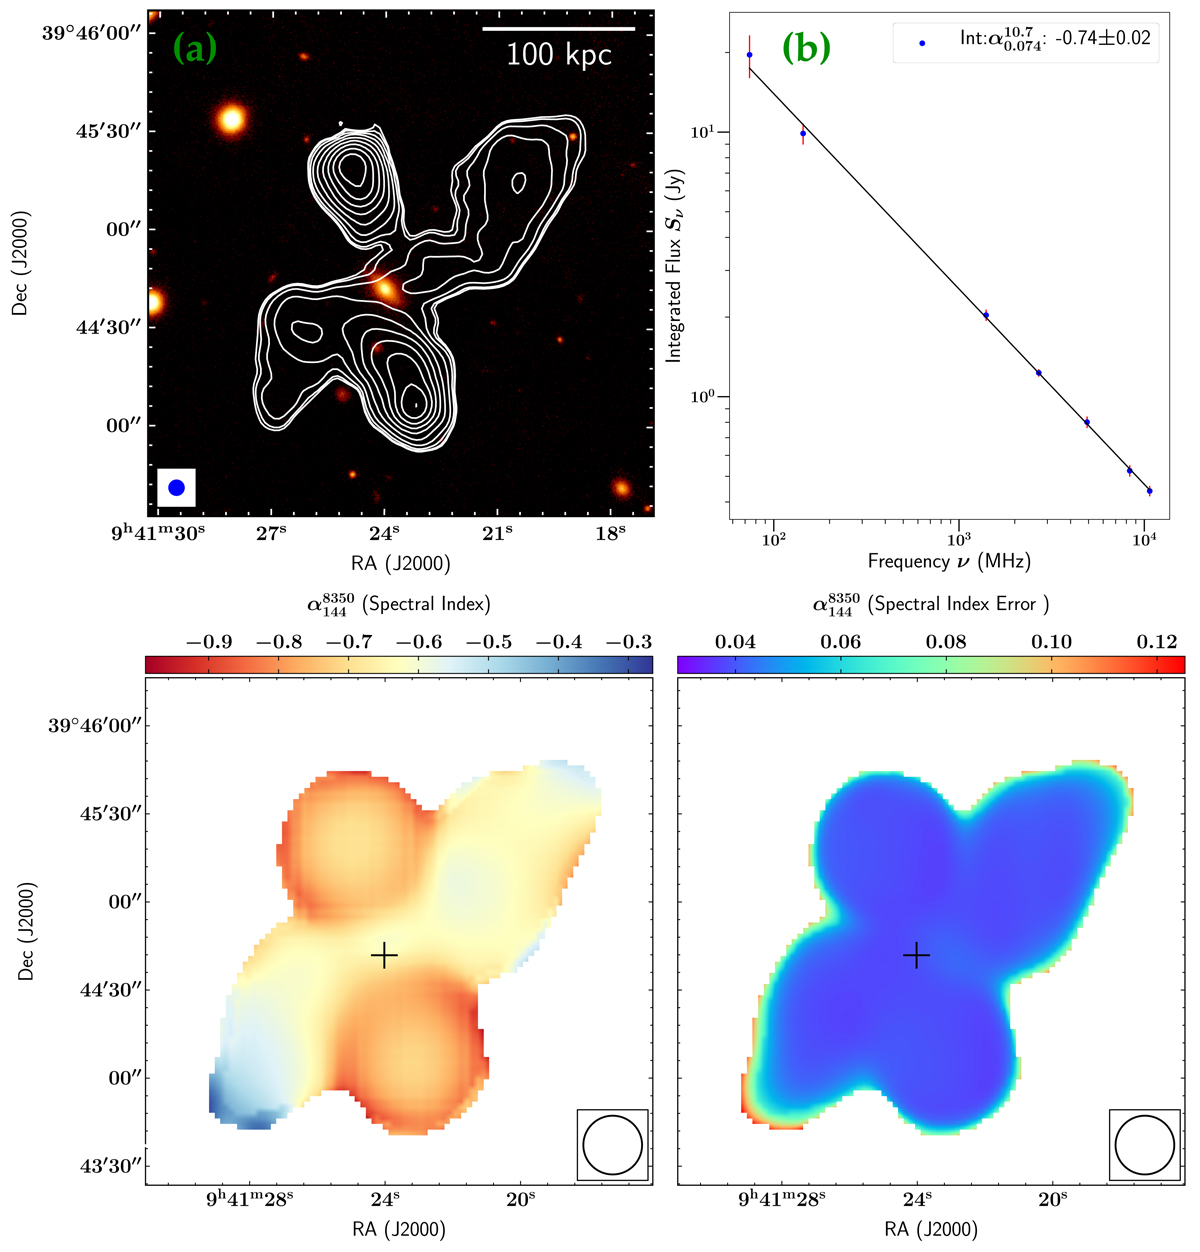
Fig. 1.
Download original image
Radio imaging and spectral data for 3C 223.1. (a) LoTSS DR2 144 MHz radio contours (levels: 0.0085, 0.0097, 0.0134, 0.0213, 0.0384, 0.0754, 0.1549, 0.3263, 0.6955, and 1.4909 Jy beam−1) of the 6″ map overlaid on PanSTARRS r band image. (b) Integrated spectral index fit from 144 to 10 700 MHz. (c) Three frequencies (144, 4910, and 8350 MHz) spectral index map and error map (d) of 3C 223.1. The beam of 20″ × 20″ is shown at the bottom right corner. The host galaxy location is shown by the black marker.
Current usage metrics show cumulative count of Article Views (full-text article views including HTML views, PDF and ePub downloads, according to the available data) and Abstracts Views on Vision4Press platform.
Data correspond to usage on the plateform after 2015. The current usage metrics is available 48-96 hours after online publication and is updated daily on week days.
Initial download of the metrics may take a while.