Fig. C.1.
Download original image
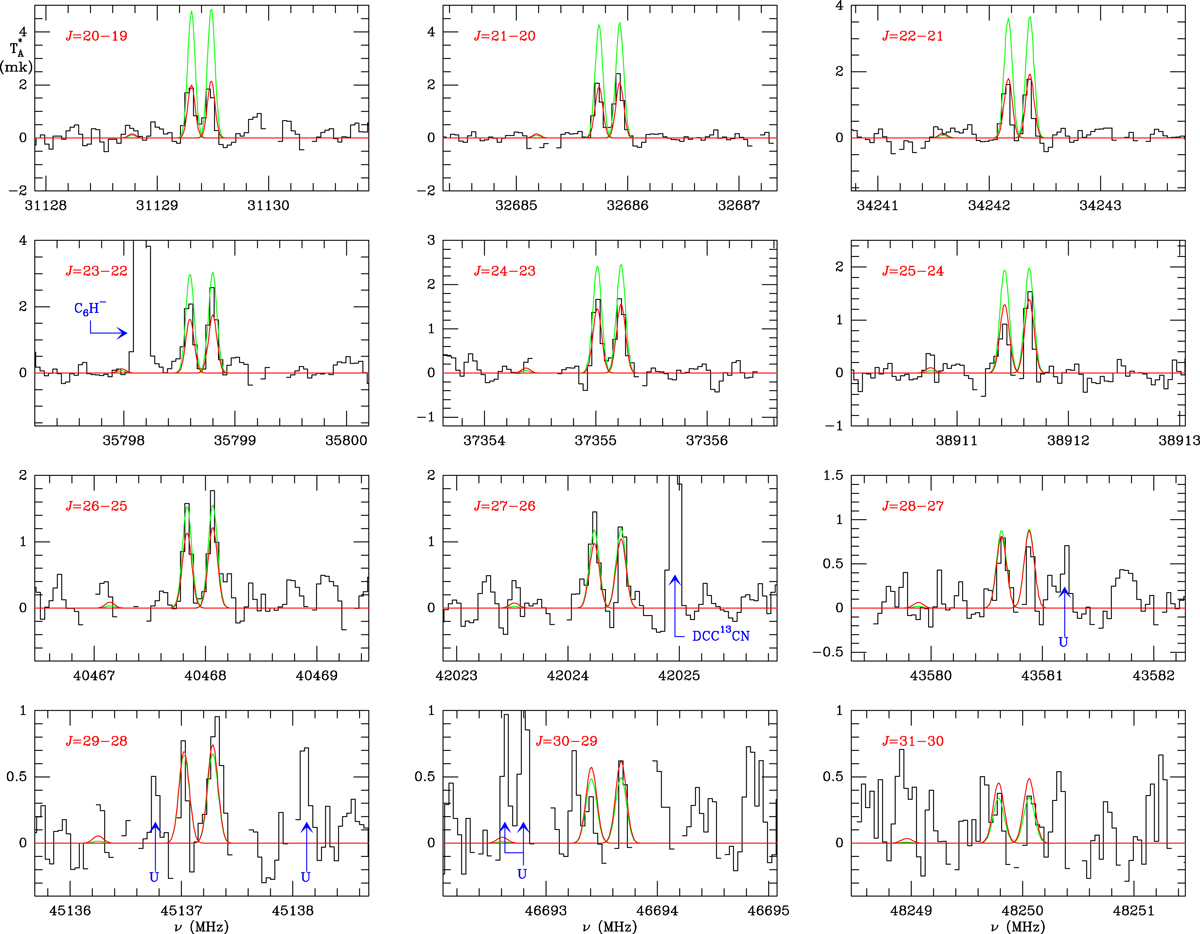
Observed transitions of CH3C6H in TMC-1. The right component corresponds to K = 0 transitions and the left component to K = 1 transitions. The abscissa corresponds to local standard of rest frequencies. Central frequencies and intensities for the observed lines are given in Table A.1. The ordinate is the antenna temperature, corrected for atmospheric and telescope losses, in milli Kelvin. The quantum numbers of each transition are indicated in the corresponding panel. The red lines show the computed synthetic spectrum for this species for Trot = 9 K and a column density of 7 × 1011 cm−2. The green line shows the computed synthetic spectrum assuming Trot = 6 K and a N=3.1 × 1012 cm−2(Remijan et al. 2006). Blanked channels correspond to negative features produced when folding the frequency-switched data.
Current usage metrics show cumulative count of Article Views (full-text article views including HTML views, PDF and ePub downloads, according to the available data) and Abstracts Views on Vision4Press platform.
Data correspond to usage on the plateform after 2015. The current usage metrics is available 48-96 hours after online publication and is updated daily on week days.
Initial download of the metrics may take a while.