Fig. 3
Download original image
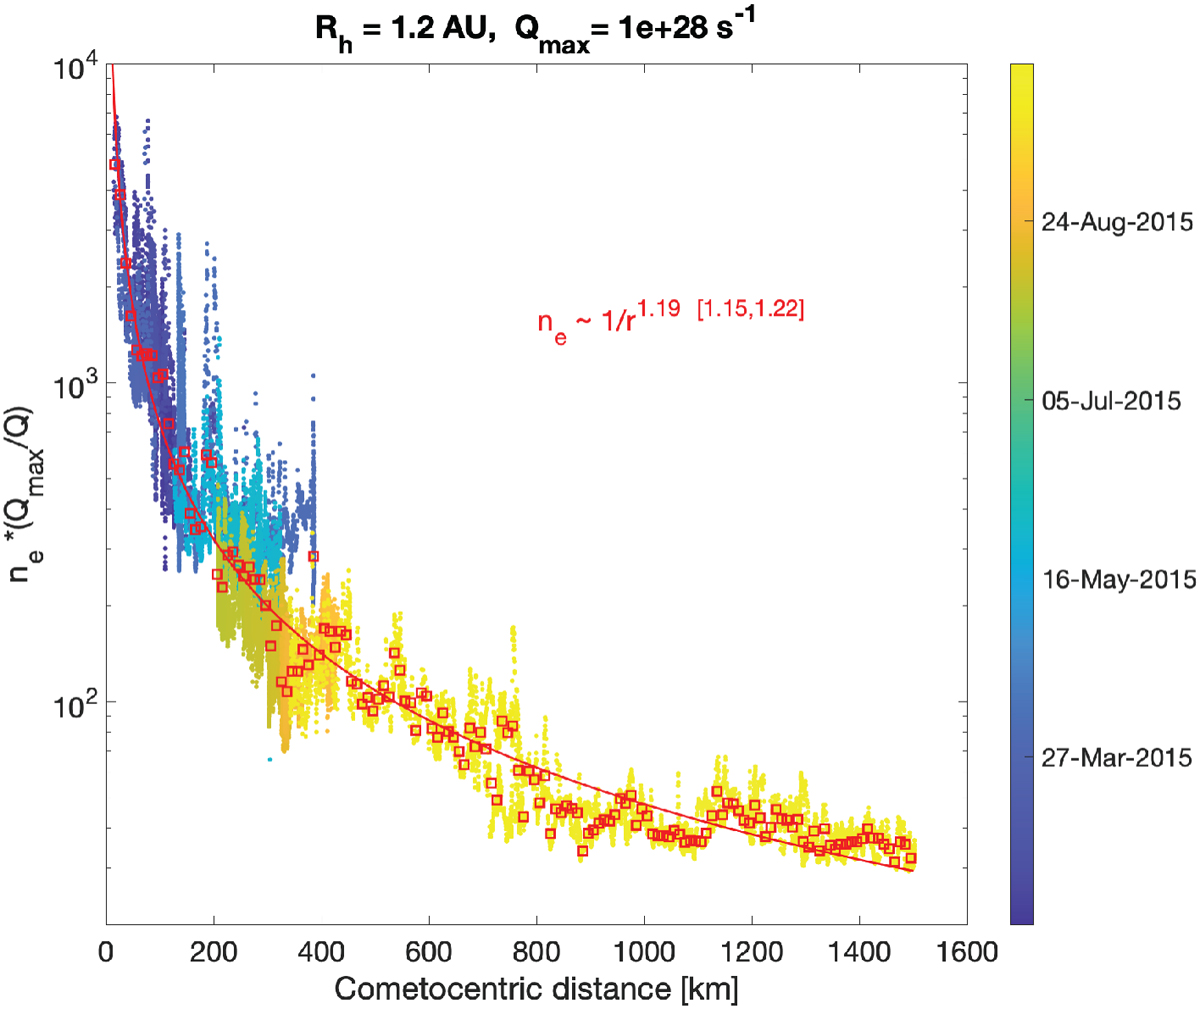
Data from the six intervals in Fig. 1 combined into one plot. The electron density from each interval has been normalised to the outgassing rate of perihelion by using the out-gassing rate model of Hansen et al. (2016) to obtain a single radial profile from approximately 10 to 1500 km. The data points are again colour-coded by time. A fit (red line) was performed to the data after it was binned in 10 km bins and median values were calculated (red squares). The exponent parameter of the fit and its 95% confidence interval is indicated in the figure.
Current usage metrics show cumulative count of Article Views (full-text article views including HTML views, PDF and ePub downloads, according to the available data) and Abstracts Views on Vision4Press platform.
Data correspond to usage on the plateform after 2015. The current usage metrics is available 48-96 hours after online publication and is updated daily on week days.
Initial download of the metrics may take a while.