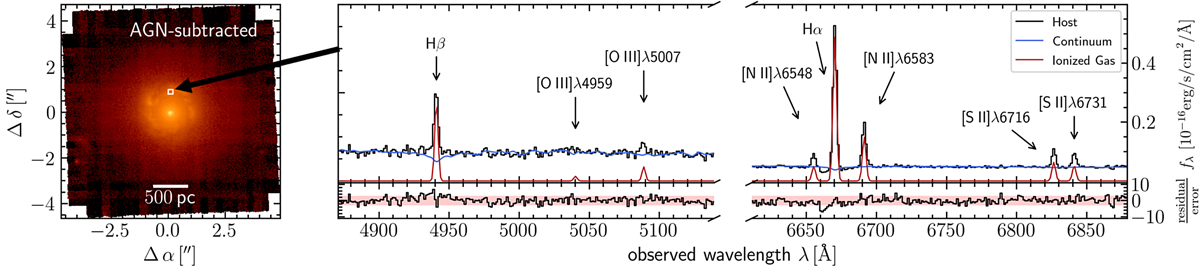
Fig. 6.
Download original image
Fitting of an example host spectrum with PyParadise. The panel on the left shows an Hα narrow-band image of the AGN-subtracted host emission. An example 8 × 8-binned spaxel is highlighted with a white square north of the nucleus. The corresponding host spectrum extracted from this aperture is shown in the right panel as a black line in the Hβ (left) and Hα window (right). Furthermore, we show the best-fit spectrum of the stellar continuum (blue) and the ionized gas contribution (red) which we obtained with PyParadise. The residuals in the bottom panels show that the model reproduces the spectrum within the 3σ confidence region.
Current usage metrics show cumulative count of Article Views (full-text article views including HTML views, PDF and ePub downloads, according to the available data) and Abstracts Views on Vision4Press platform.
Data correspond to usage on the plateform after 2015. The current usage metrics is available 48-96 hours after online publication and is updated daily on week days.
Initial download of the metrics may take a while.