Fig. 4.
Download original image
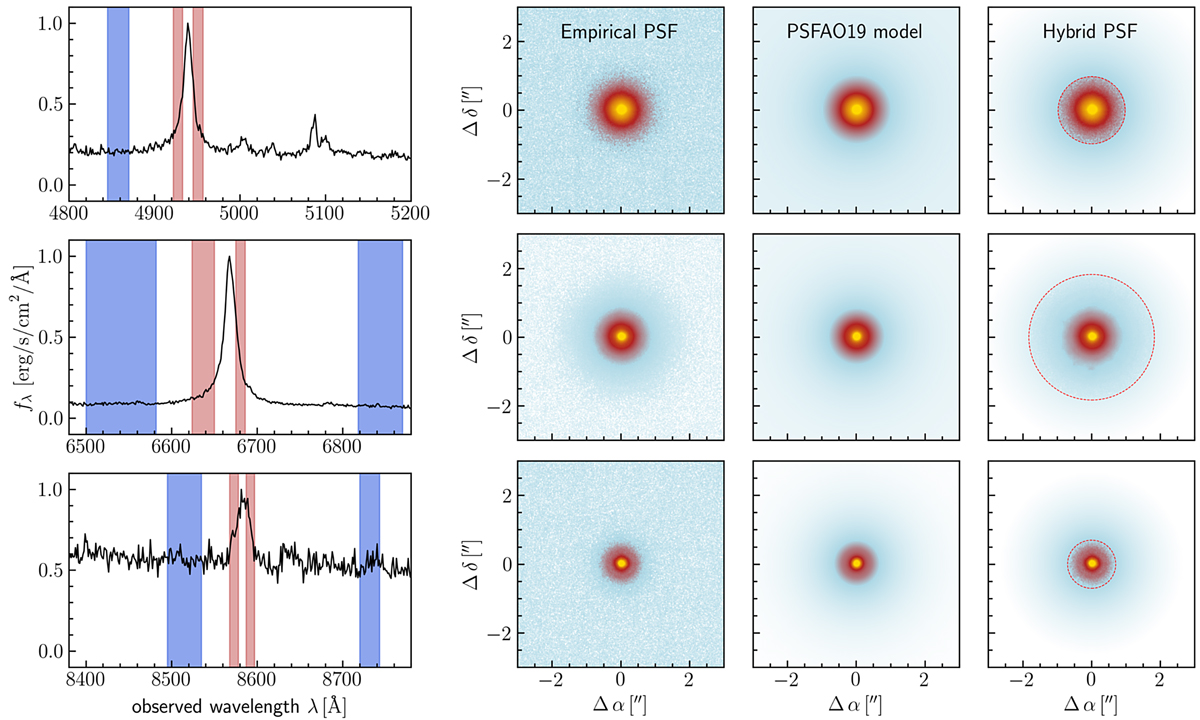
Construction of hybrid PSF from the MUSE data cube. The left panels show the continuum (blue) and broad-line (red) spectral regions from which the broad-line intensity was extracted around Hβ, Hα, and O Iλ8446+Ca IIλ8498 (from top to bottom). The resulting empirical PSFs with logarithmic intensity scaling are shown in the second column. The corresponding best-fit PSFAO19 models are shown in the third column. The fourth column shows the hybrid PSFs which we generated by replacing the empirical PSFs with the modeled PSFs beyond the radius where the S/N drops below a threshold value (dashed red circle).
Current usage metrics show cumulative count of Article Views (full-text article views including HTML views, PDF and ePub downloads, according to the available data) and Abstracts Views on Vision4Press platform.
Data correspond to usage on the plateform after 2015. The current usage metrics is available 48-96 hours after online publication and is updated daily on week days.
Initial download of the metrics may take a while.