Fig. 3.
Download original image
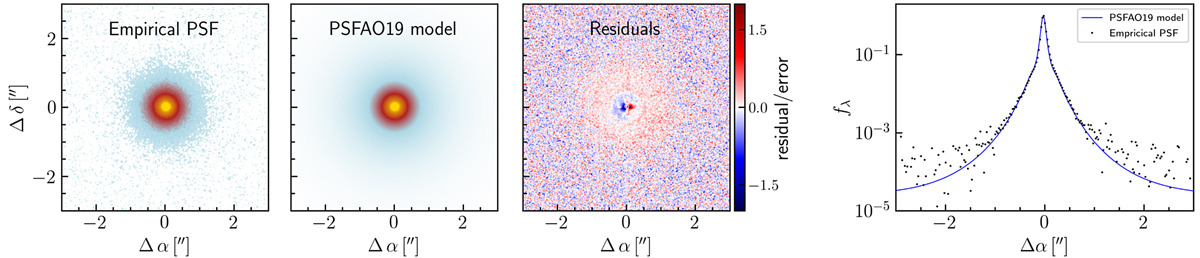
Fitting the MUSE NFM-AO PSF. From left to right, the panels show the empirical PSF for the broad Hβ line extracted as described in Sect. 2.4.1, the corresponding PSFAO19 model, and the residual flux map. The rightmost panel shows the cross section of the PSF at the QSO position and fixed δ. While the turbulent halo of the AO-induced PSF is well reproduced by the PSFAO19 model, the systematic errors near the center are significant compared to the relatively faint host signal.
Current usage metrics show cumulative count of Article Views (full-text article views including HTML views, PDF and ePub downloads, according to the available data) and Abstracts Views on Vision4Press platform.
Data correspond to usage on the plateform after 2015. The current usage metrics is available 48-96 hours after online publication and is updated daily on week days.
Initial download of the metrics may take a while.