Fig. 11.
Download original image
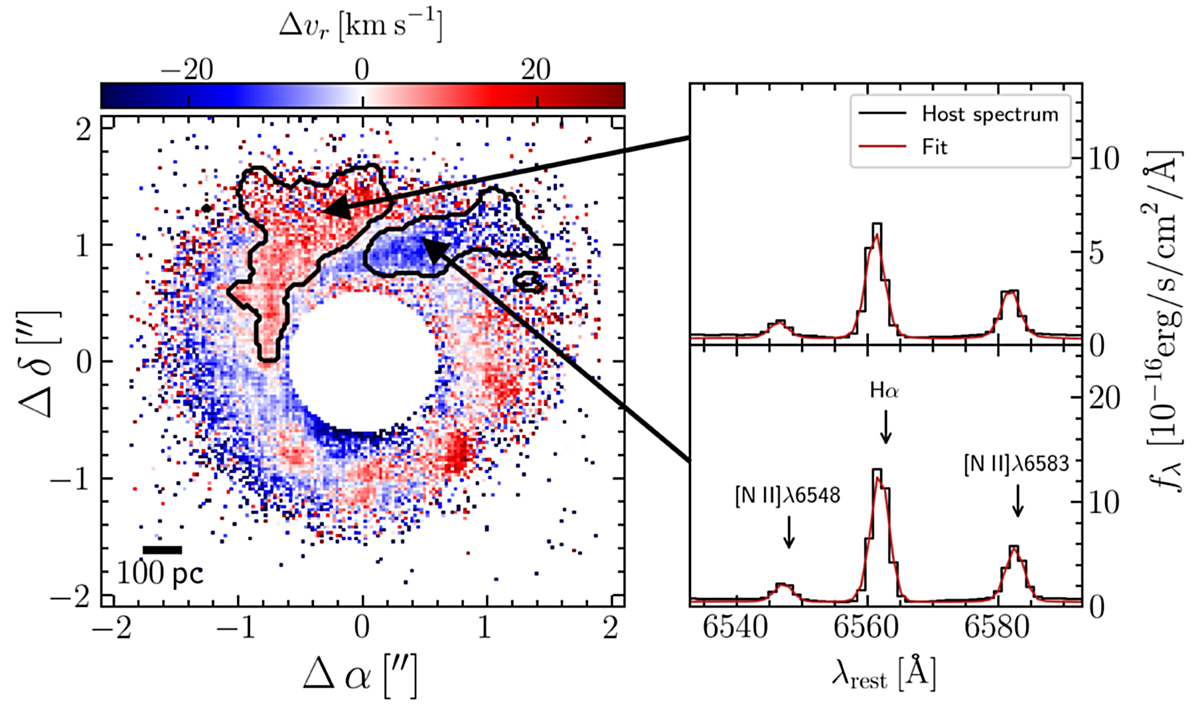
Zoom-in onto the clumpy structures detected in the residual gas velocity Δvr after subtracting the rotating thin disk model. The contours highlight spaxels of the smoothed map (see text) and correspond to an approaching (blue) and receding (red) clump, respectively. The panels on the right show the rest-frame spectra of the host in the Hα+[N II] region, integrated over the respective patch. The emission lines have a symmetric shape and are well reproduced by the fit, indicating a genuine shift of the velocity residuals Δvr.
Current usage metrics show cumulative count of Article Views (full-text article views including HTML views, PDF and ePub downloads, according to the available data) and Abstracts Views on Vision4Press platform.
Data correspond to usage on the plateform after 2015. The current usage metrics is available 48-96 hours after online publication and is updated daily on week days.
Initial download of the metrics may take a while.