Fig. 10.
Download original image
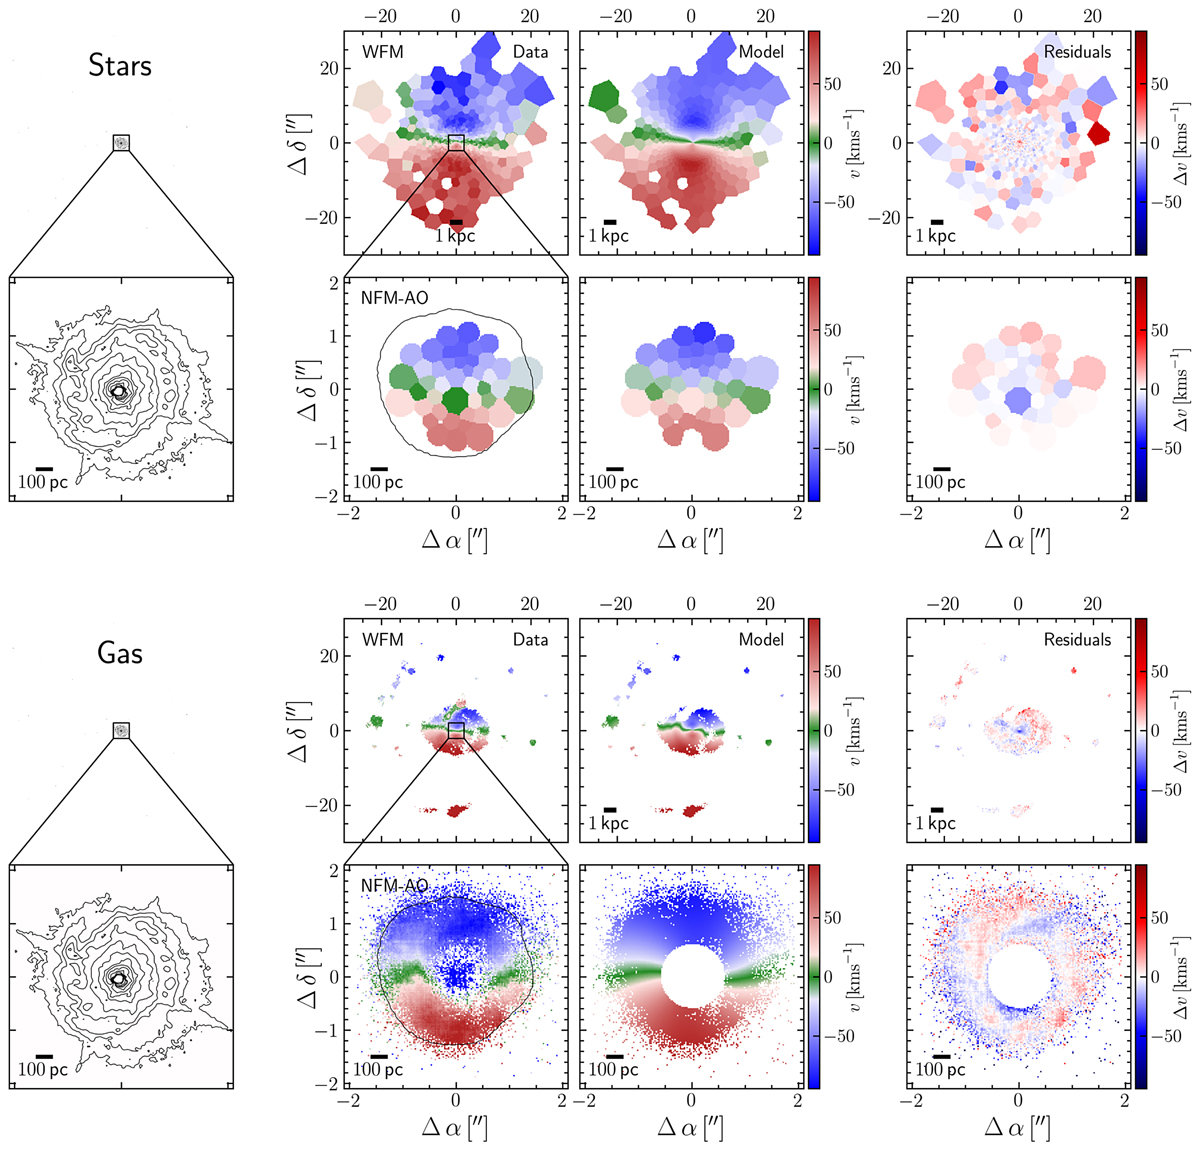
Modeling the stellar (top) and ionized gas velocity field (bottom) with a thin rotating disk. For each of the two fields, the panels are organized as follows: From left to right, the panels show (1) the contours of the HST WFC3/UVIS image; (2) Mrk 1044’s stellar and ionized gas velocity field; (3) the kinematic model of a rotating disk; and (4) the difference between the observed and model velocity field. For the stars and ionized gas, respectively, the top panels show the MUSE WFM data and the bottom panels the zoom-in onto the NFM-AO data. For the ionized gas velocity field, we excluded the innermost ![]() where the gas does not corotate with the disk. Both the stellar and ionized gas are well reproduced by the rotating disk model. Only the ionized gas shows tenuous clumpy structures in the velocity residuals which are highlighted in Fig. 11.
where the gas does not corotate with the disk. Both the stellar and ionized gas are well reproduced by the rotating disk model. Only the ionized gas shows tenuous clumpy structures in the velocity residuals which are highlighted in Fig. 11.
Current usage metrics show cumulative count of Article Views (full-text article views including HTML views, PDF and ePub downloads, according to the available data) and Abstracts Views on Vision4Press platform.
Data correspond to usage on the plateform after 2015. The current usage metrics is available 48-96 hours after online publication and is updated daily on week days.
Initial download of the metrics may take a while.