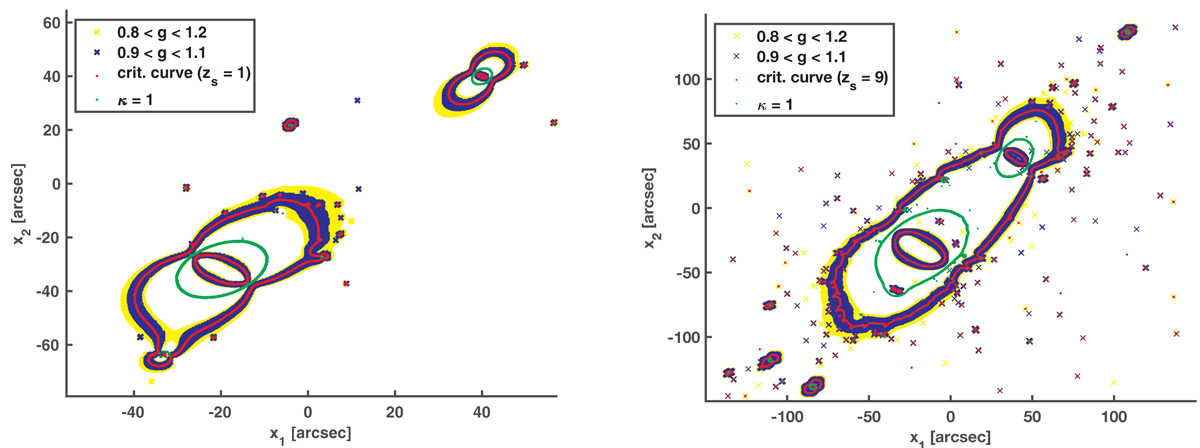
Fig. 4.
Download original image
Regions around the critical curve (red) fulfiling Eq. (25) for δg = 0.1 (blue) and δg = 0.2 (yellow) for the ARES simulation using a source redshift of zs = 1 (left), and zs = 9 (right). Regions with κ = 1 (green) mark areas containing multiple images that are not scaled and could therefore be used to break the mass-sheet degeneracy (see Sect. 3.3).
Current usage metrics show cumulative count of Article Views (full-text article views including HTML views, PDF and ePub downloads, according to the available data) and Abstracts Views on Vision4Press platform.
Data correspond to usage on the plateform after 2015. The current usage metrics is available 48-96 hours after online publication and is updated daily on week days.
Initial download of the metrics may take a while.