Fig. 8.
Download original image
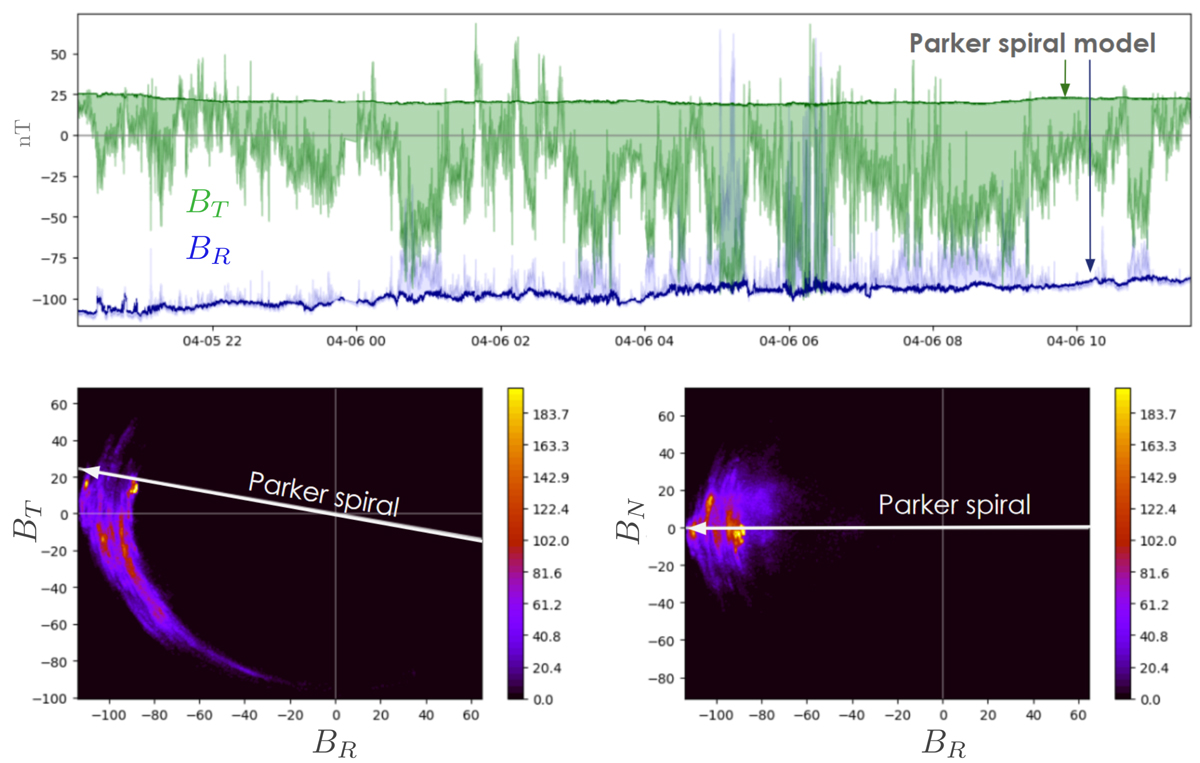
Illustration of a one-sided patch of switchbacks. Top panel: radial and tangential component of the magnetic field, BR and BT, as well as the expected components of the Parker spiral magnetic field. The difference between model and data is lightly shaded. In the bottom panels, we plot the 2D distributions f(BR, BT) and f(BR, BN); the color scale indicates the number of points inside each bin.
Current usage metrics show cumulative count of Article Views (full-text article views including HTML views, PDF and ePub downloads, according to the available data) and Abstracts Views on Vision4Press platform.
Data correspond to usage on the plateform after 2015. The current usage metrics is available 48-96 hours after online publication and is updated daily on week days.
Initial download of the metrics may take a while.