Fig. 5.
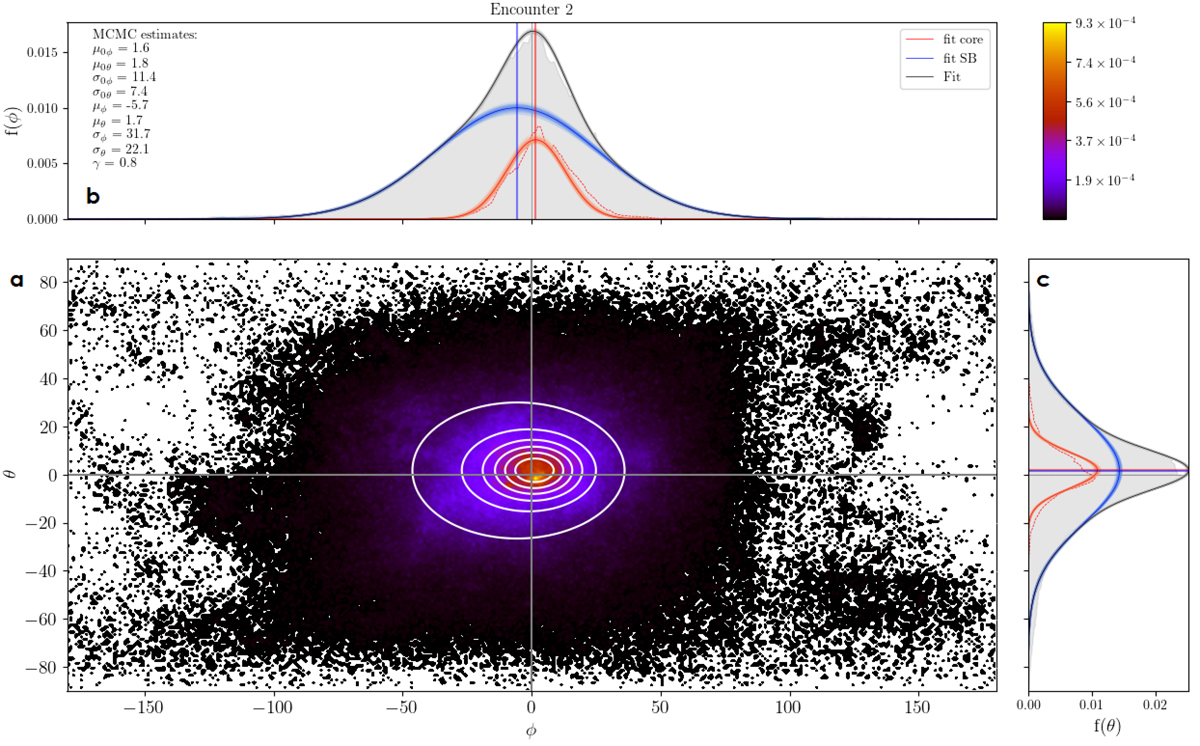
Download original image
2D distribution of magnetic field orientation angles for E2 (panel a) together with the marginal distributions of ϕ and θ in light gray in panels b and c. The white contours in panel a represent the fitted function, and its marginal distributions are in black in panels b and c. We also plot in panels b and c the marginal distributions corresponding to quiet solar wind (red) and switchback (blue) populations, with lines indicating their mean. The curves in lighter red, blue, and black give a sense of the fit precision. Finally, in dashed red we display the quiet solar wind distribution found for E2 2 as displayed in Fig. 2 but multiplied by (1 − γ) so that the scales are comparable. See the text for more detail.
Current usage metrics show cumulative count of Article Views (full-text article views including HTML views, PDF and ePub downloads, according to the available data) and Abstracts Views on Vision4Press platform.
Data correspond to usage on the plateform after 2015. The current usage metrics is available 48-96 hours after online publication and is updated daily on week days.
Initial download of the metrics may take a while.