Fig. 4.
Download original image
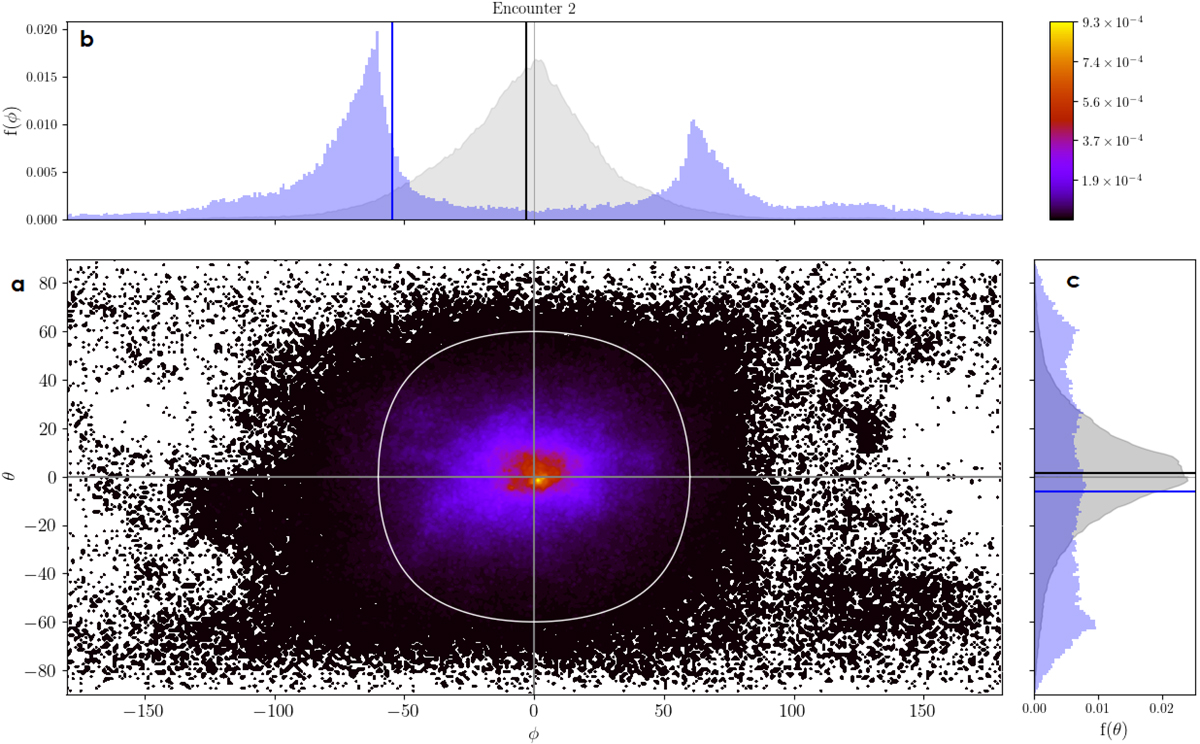
2D normalized distribution of magnetic field orientation angles for E2 (panel a) together with the marginal distributions of ϕ and θ in light gray in panels b and c. Black lines indicate the median values of the marginal distributions. The white line in panel a corresponds to a 60° threshold angle (see the text for more details), and in panels b and c we overlay in light blue the distribution of the points outside this line. The blue lines indicate the median values of these truncated blue distributions.
Current usage metrics show cumulative count of Article Views (full-text article views including HTML views, PDF and ePub downloads, according to the available data) and Abstracts Views on Vision4Press platform.
Data correspond to usage on the plateform after 2015. The current usage metrics is available 48-96 hours after online publication and is updated daily on week days.
Initial download of the metrics may take a while.