Fig. 3
Download original image
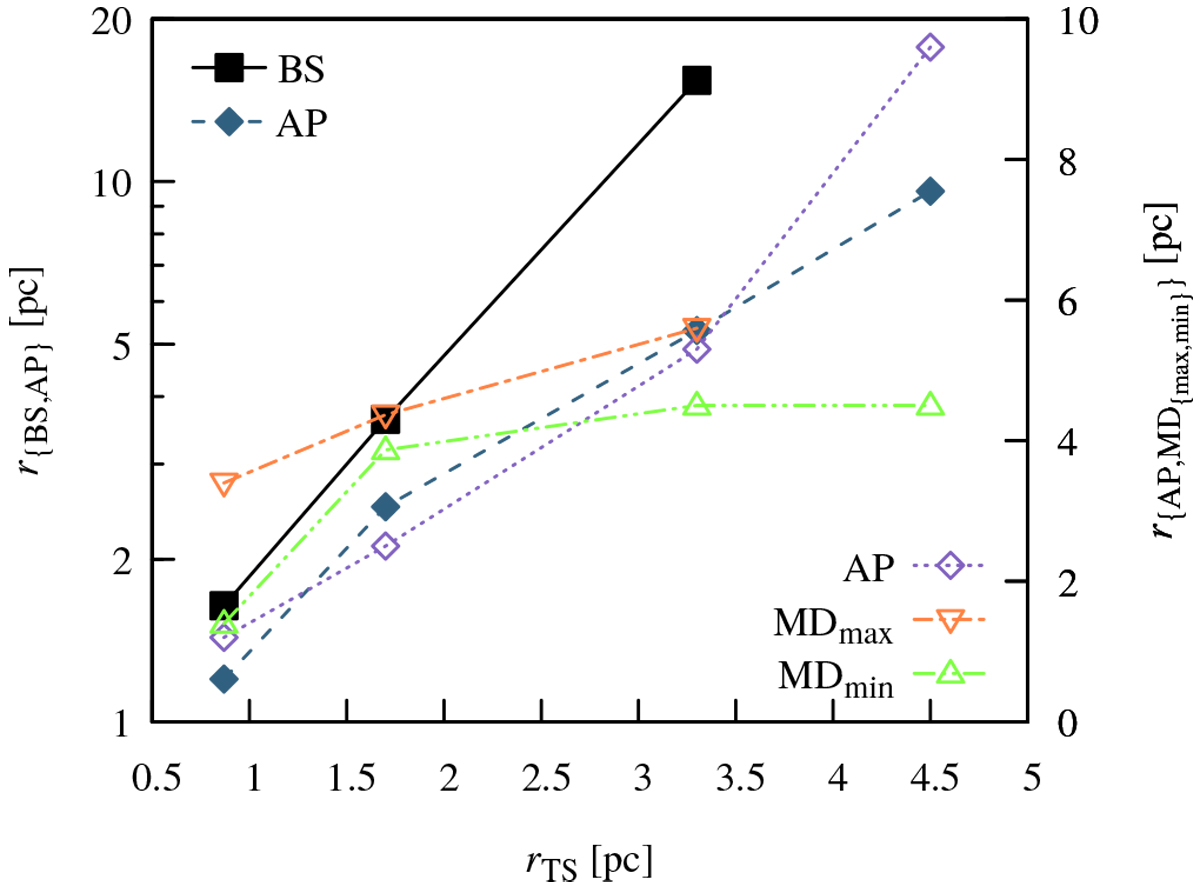
Distances, ![]() , of the BS, AP, and the MD in its most distended (max) and compressed (min) positions along the central axis of the 2D models (Table 3) against the respective TS distance, rTS, making use of both logarithmic (left ordinate axis, filled symbols) and linear (right ordinate axis, empty symbols) scaling; the abscissa has been scaled linearly. The AP has been plotted on both scales. Colours as in Fig. 2 with the exception of the linearly scaled AP (purple dotted line).
, of the BS, AP, and the MD in its most distended (max) and compressed (min) positions along the central axis of the 2D models (Table 3) against the respective TS distance, rTS, making use of both logarithmic (left ordinate axis, filled symbols) and linear (right ordinate axis, empty symbols) scaling; the abscissa has been scaled linearly. The AP has been plotted on both scales. Colours as in Fig. 2 with the exception of the linearly scaled AP (purple dotted line).
Current usage metrics show cumulative count of Article Views (full-text article views including HTML views, PDF and ePub downloads, according to the available data) and Abstracts Views on Vision4Press platform.
Data correspond to usage on the plateform after 2015. The current usage metrics is available 48-96 hours after online publication and is updated daily on week days.
Initial download of the metrics may take a while.