Fig. 2
Download original image
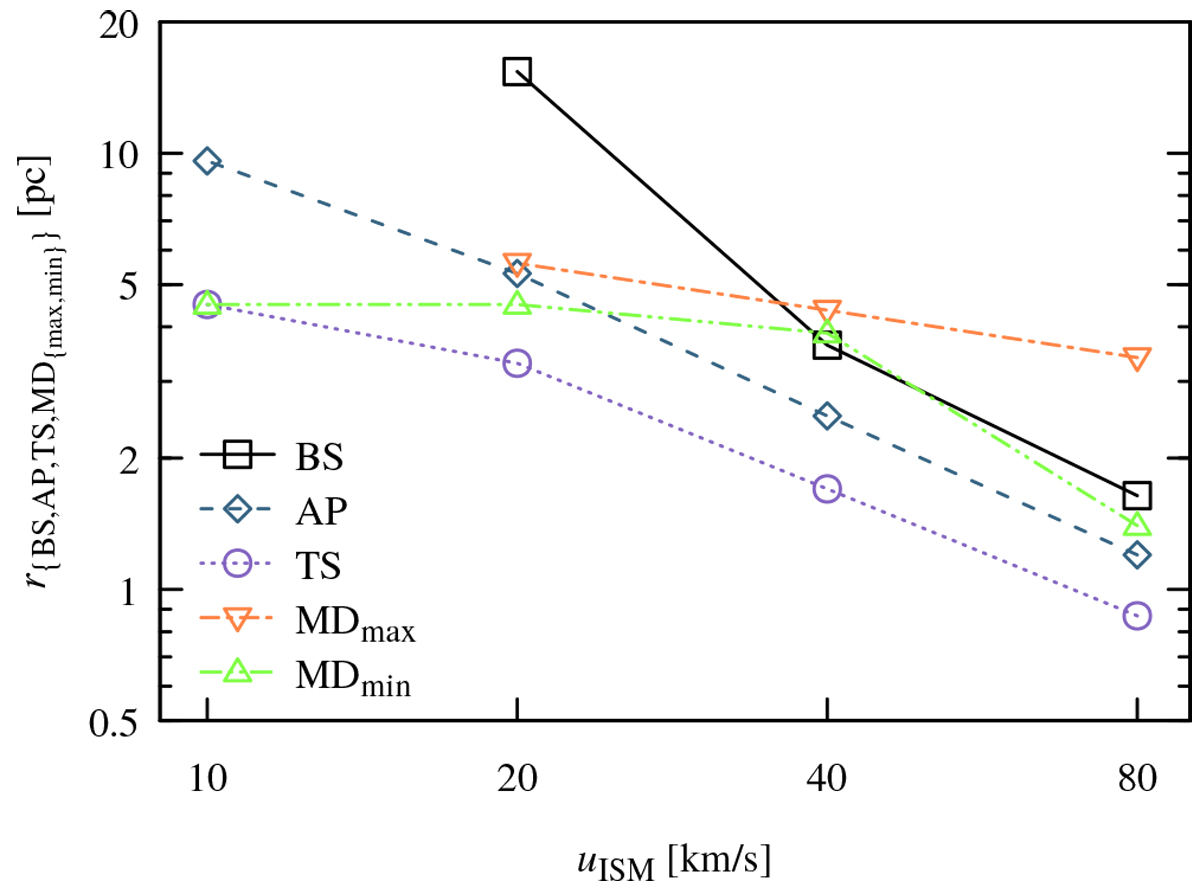
Distances, ![]() , of the BS (black squares, solid line), AP (blue diamonds, dashed line), TS (purple circles, dotted line), and the MD in its most distended (MDmax, orange triangles, dash-dotted line) and compressed (MDmin, green pyramids, dash-dot-dotted line) positions along the central axis of the 2D models (Table 3) against the respective inflow speed, uISM. Both axes are scaled logarithmically.
, of the BS (black squares, solid line), AP (blue diamonds, dashed line), TS (purple circles, dotted line), and the MD in its most distended (MDmax, orange triangles, dash-dotted line) and compressed (MDmin, green pyramids, dash-dot-dotted line) positions along the central axis of the 2D models (Table 3) against the respective inflow speed, uISM. Both axes are scaled logarithmically.
Current usage metrics show cumulative count of Article Views (full-text article views including HTML views, PDF and ePub downloads, according to the available data) and Abstracts Views on Vision4Press platform.
Data correspond to usage on the plateform after 2015. The current usage metrics is available 48-96 hours after online publication and is updated daily on week days.
Initial download of the metrics may take a while.