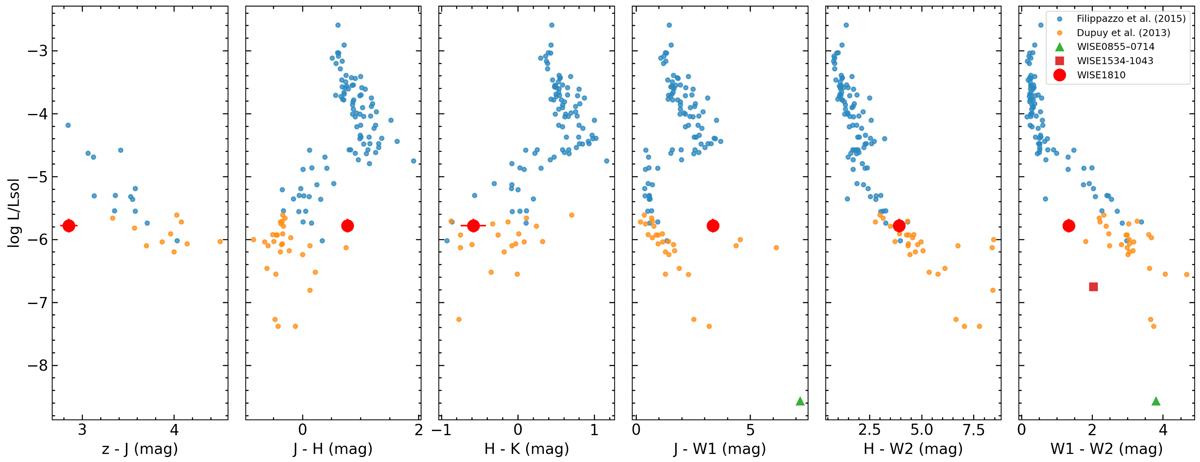
Fig. 9.
Download original image
Colour–luminosity diagrams of solar-metallicity L, T, and Y dwarfs. L0–T7 dwarfs are plotted as blue dots while T8–Y1 dwarfs are shown as orange dots. WISE1810 is plotted as a red dot. In the right panel, and for comparison purposes, two objects: WISEA J153429.75−104303.3, the first Y subdwarf candidate (known as “the Accident”; Kirkpatrick et al. 2021b), and WISE J085510.83−071442.5, the nearest brown dwarf to the Sun at 2.2 pc (Luhman 2014).
Current usage metrics show cumulative count of Article Views (full-text article views including HTML views, PDF and ePub downloads, according to the available data) and Abstracts Views on Vision4Press platform.
Data correspond to usage on the plateform after 2015. The current usage metrics is available 48-96 hours after online publication and is updated daily on week days.
Initial download of the metrics may take a while.