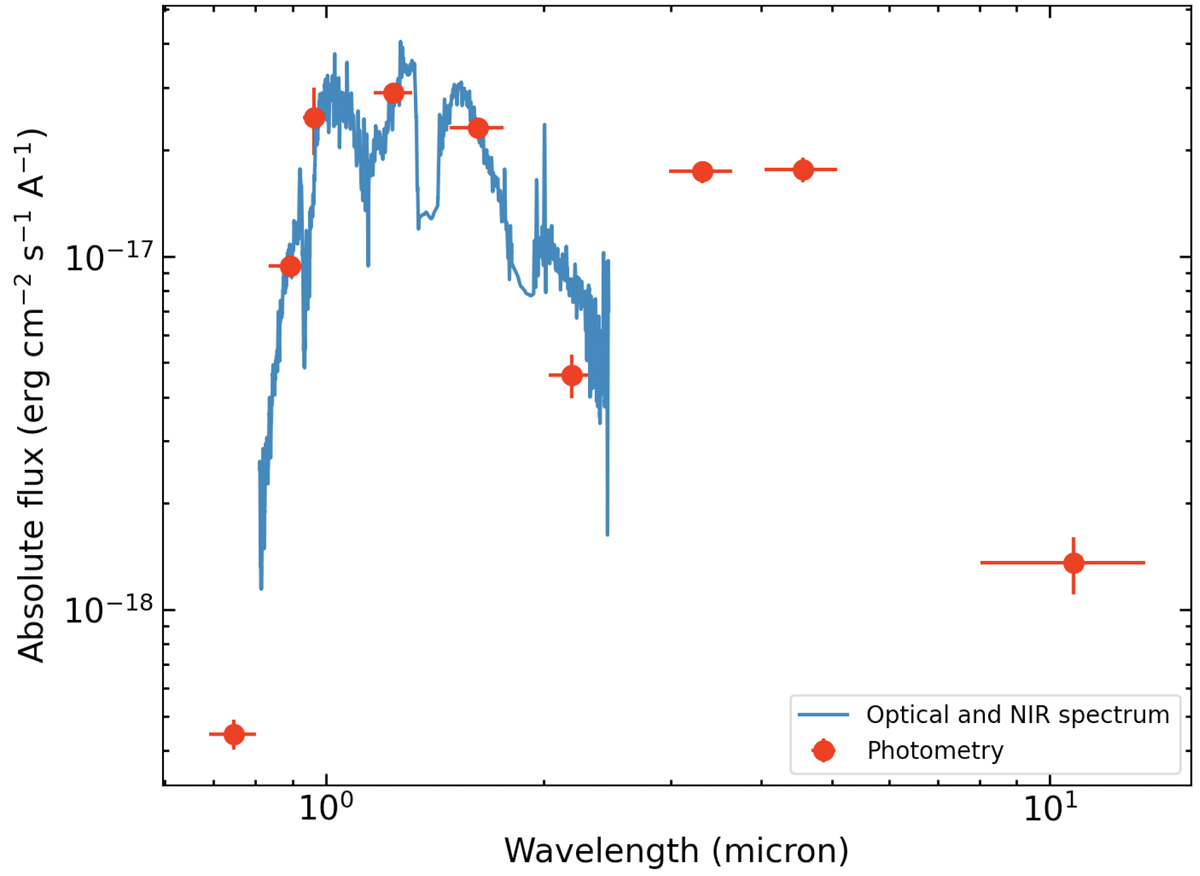
Fig. 8.
Download original image
Combined photometric and spectroscopic spectral energy distribution of WISE1810. All OSIRIS, EMIR and Schneider et al. (2020) spectra are smoothed for the clarity of the figure. Photometric fluxes (red dots) correspond to, from blue to red wavelengths, the i, z, y, J, H, K, W1, W2, and W3 bands. Horizontal error bars stand for the effective width of the filters while vertical error bars account for the photometric uncertainties.
Current usage metrics show cumulative count of Article Views (full-text article views including HTML views, PDF and ePub downloads, according to the available data) and Abstracts Views on Vision4Press platform.
Data correspond to usage on the plateform after 2015. The current usage metrics is available 48-96 hours after online publication and is updated daily on week days.
Initial download of the metrics may take a while.