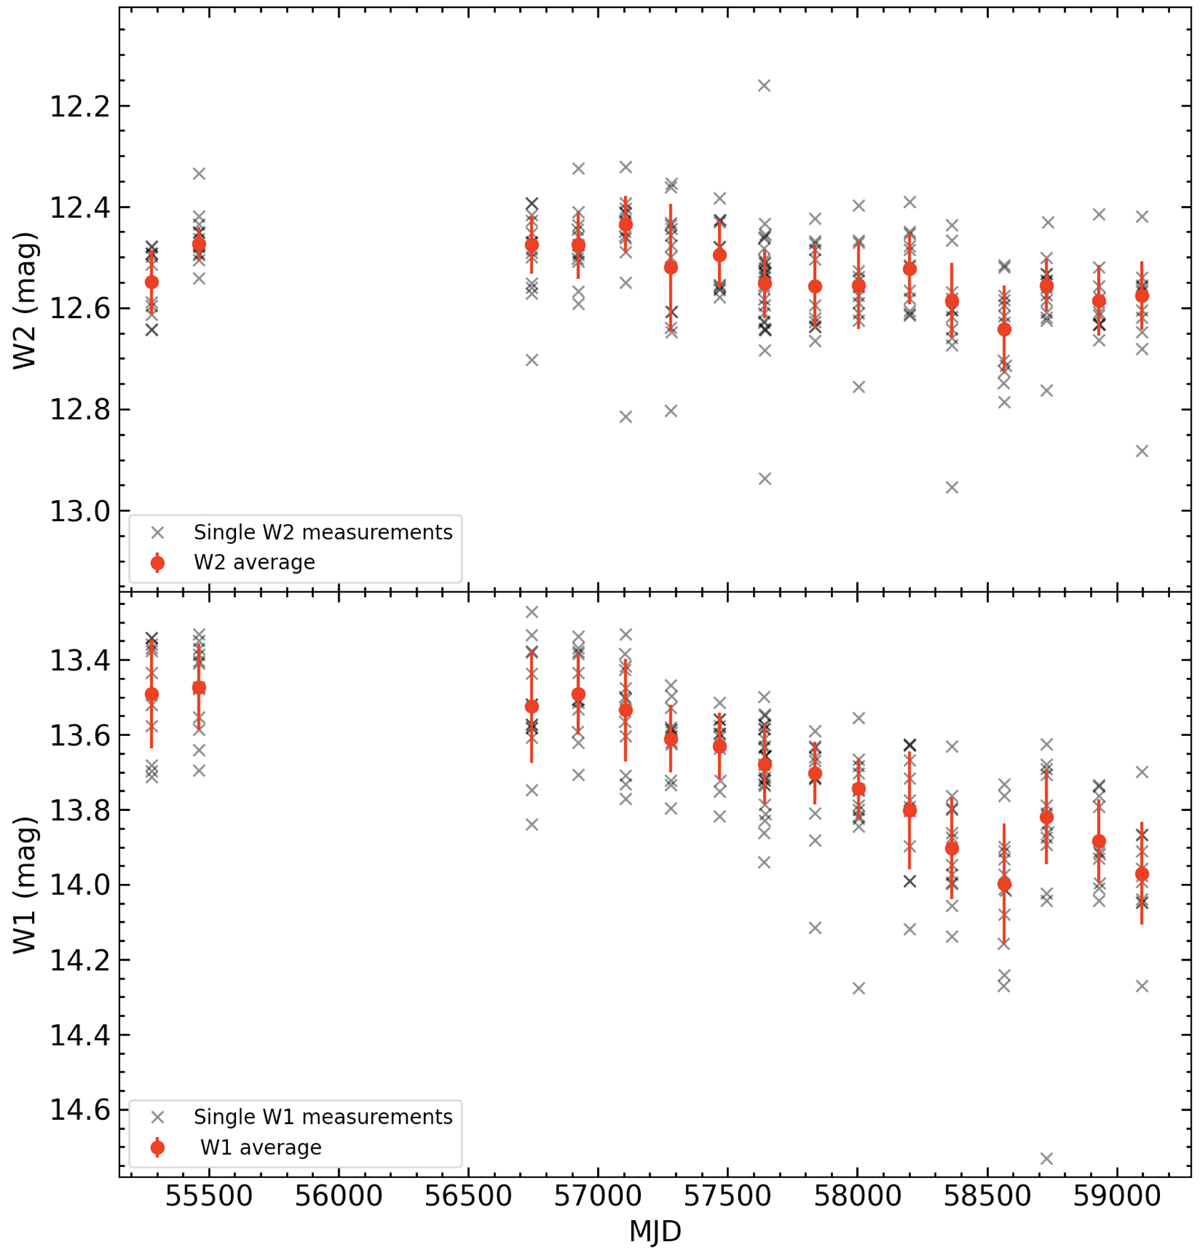
Fig. 4.
Download original image
WISE W2 (top) and W1 (bottom) photometry of WISE1810 over time. Individual measurements are plotted as gray crosses, the average photometry per observing epoch is plotted as red dots. Error bars account for the photometric dispersion. Both filters show a decreasing trend likely due to flux contamination by a background star. NEOWISE data (Mainzer et al. 2011) were acquired between modified Julian dates (MJD) = 56742.7 and 59096.3.
Current usage metrics show cumulative count of Article Views (full-text article views including HTML views, PDF and ePub downloads, according to the available data) and Abstracts Views on Vision4Press platform.
Data correspond to usage on the plateform after 2015. The current usage metrics is available 48-96 hours after online publication and is updated daily on week days.
Initial download of the metrics may take a while.