Fig. 9
Download original image
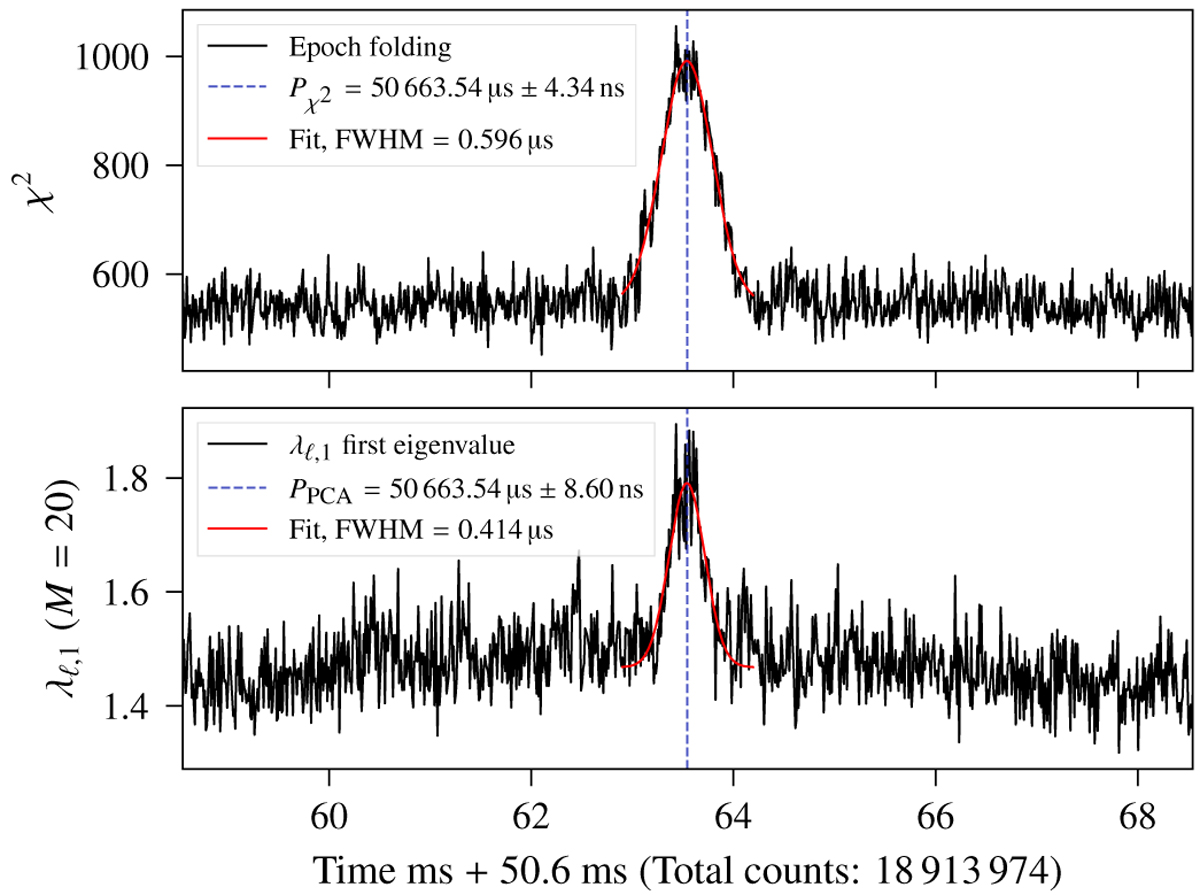
First eigenvalue compared to epoch folding for PSR B0540-69. The top panel shows the χ2 optimization and the bottom panel the first PC eigenvalue for a waterfall ![]() with M = 20 number of divisions. The eigenvalue, λℓ,1 presents a noisier signal, i.e., a lower signal-to-noise ratio. However, the maximum from each plot reaches a similar result within less than 10 ns. The periods, Px2 and PPCA, were determined by a least-squares fit and adjusting a Gaussian (red line). The center of the Gaussian is the reported period, and the errors are 4.34 ns and 8.60 ns. The FWHM of the Gaussian is also reported. Both sets were started with the same initial conditions, ∆s = 10 ns, ∆t = 1 ms, number of iterations, and initial trial period.
with M = 20 number of divisions. The eigenvalue, λℓ,1 presents a noisier signal, i.e., a lower signal-to-noise ratio. However, the maximum from each plot reaches a similar result within less than 10 ns. The periods, Px2 and PPCA, were determined by a least-squares fit and adjusting a Gaussian (red line). The center of the Gaussian is the reported period, and the errors are 4.34 ns and 8.60 ns. The FWHM of the Gaussian is also reported. Both sets were started with the same initial conditions, ∆s = 10 ns, ∆t = 1 ms, number of iterations, and initial trial period.
Current usage metrics show cumulative count of Article Views (full-text article views including HTML views, PDF and ePub downloads, according to the available data) and Abstracts Views on Vision4Press platform.
Data correspond to usage on the plateform after 2015. The current usage metrics is available 48-96 hours after online publication and is updated daily on week days.
Initial download of the metrics may take a while.