Fig. 8
Download original image
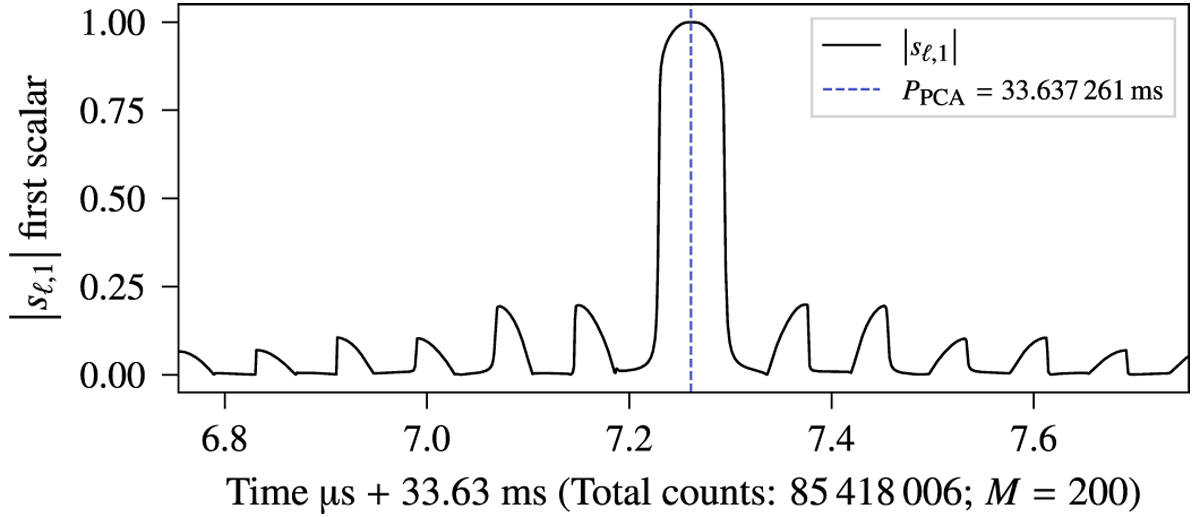
Absolute value of the scalar product, |sℓ,1| (1), of the first PC eigenvector with the 200-dimension hyperdiagonal unitary vector as a function of the trial period in the case of the Crab pulsar. The scalar product (when a high signal-to-noise ratio is available) reaches magnitude i in a plateau region. Eigenvalue and scalar are plotted together in Fig. 15. The period PPCA was computed with the first PC eigenvalue, Fig. 6.
Current usage metrics show cumulative count of Article Views (full-text article views including HTML views, PDF and ePub downloads, according to the available data) and Abstracts Views on Vision4Press platform.
Data correspond to usage on the plateform after 2015. The current usage metrics is available 48-96 hours after online publication and is updated daily on week days.
Initial download of the metrics may take a while.