Fig. 7
Download original image
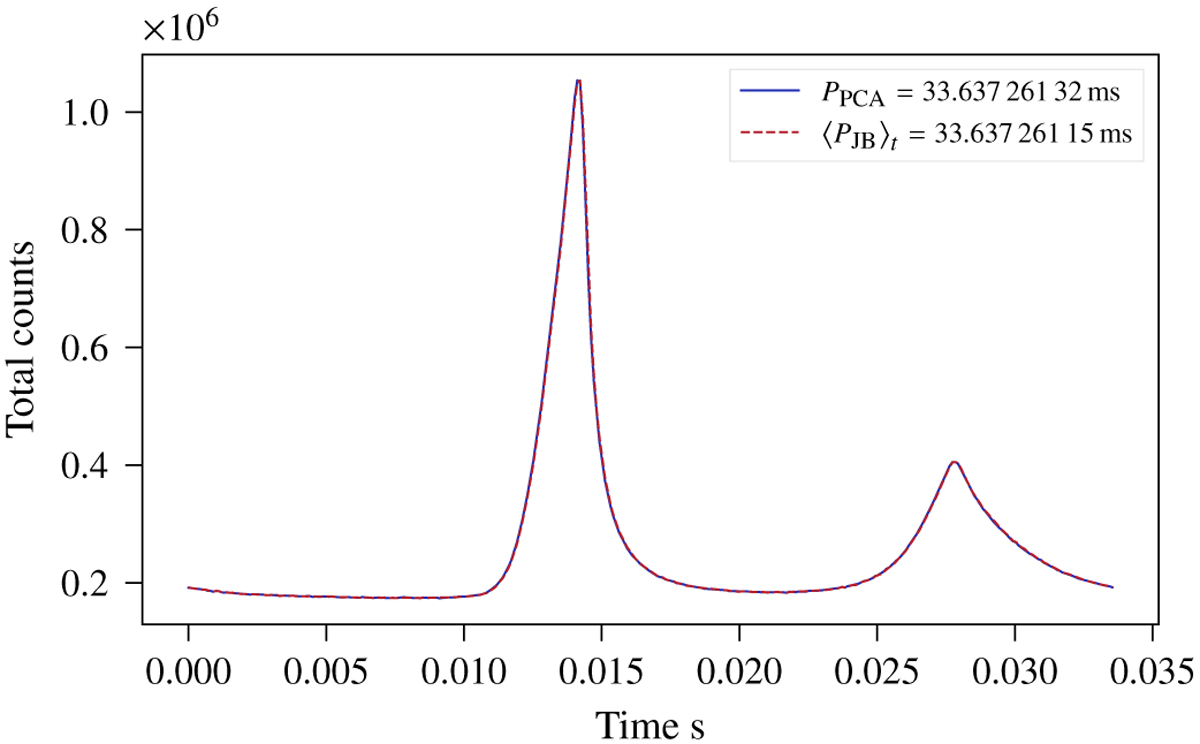
Crab pulsar (PSR B0531+21) light curve obtained by folding the data with the period found using the maximum value of the first PC eigenvalue, PPCA (as shown in Fig. 6), and compared to the period from the Jodrell Bank monthly ephemerides, PJB. The Jodrell Bank period was computed using PINT at the observation time, and the period 〈PJB〉t was obtained by averaging over the whole transit (of duration t = 7200 s). The difference between the two methods is |ppca−〈pjb〉t|= 0·1766rn.
Current usage metrics show cumulative count of Article Views (full-text article views including HTML views, PDF and ePub downloads, according to the available data) and Abstracts Views on Vision4Press platform.
Data correspond to usage on the plateform after 2015. The current usage metrics is available 48-96 hours after online publication and is updated daily on week days.
Initial download of the metrics may take a while.