Fig. 5
Download original image
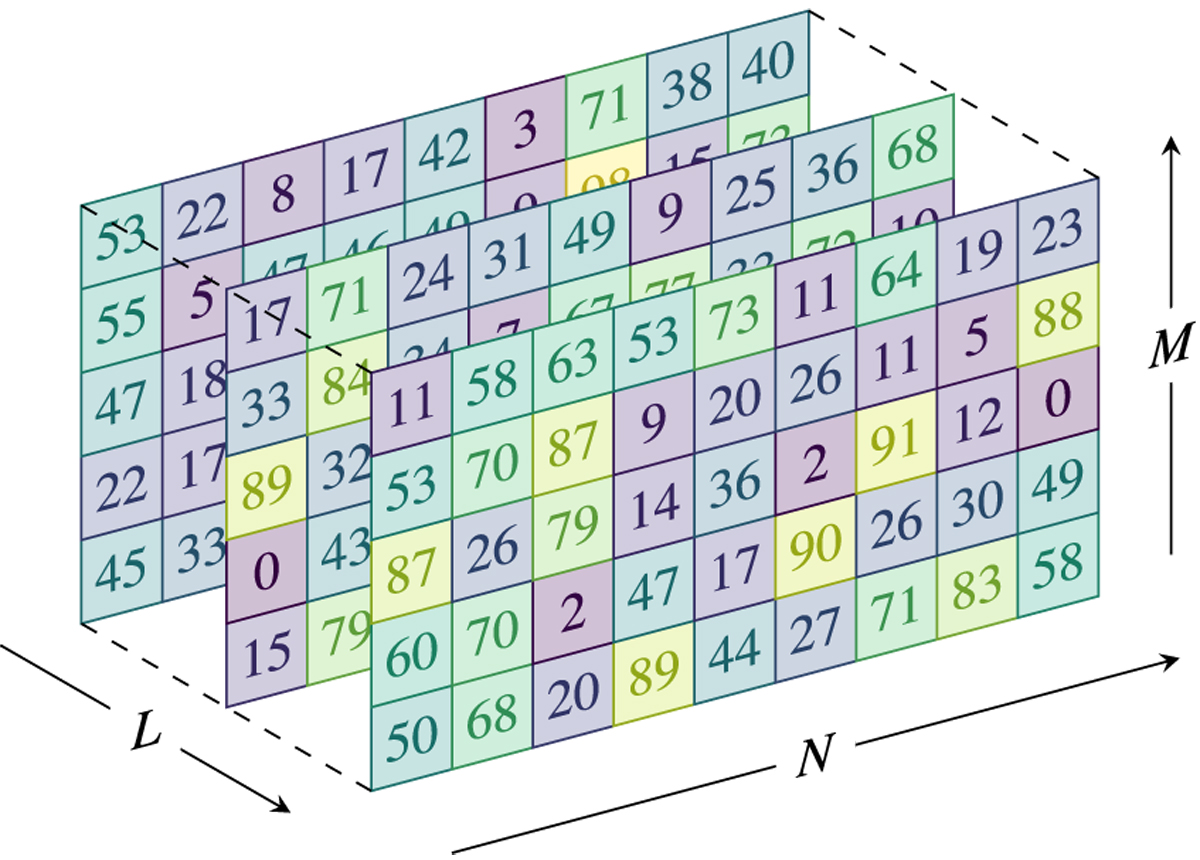
Waterfall diagrams, W`, where each sheet has M × N dimension. M corresponds to the number of divisions (number of rows), N is the number given by the trial period Pℓ (i.e., Pt of the iteration ℓ) divided by a chosen time bin ∆t: N = round [Pℓ/∆t]. A data point has an amplitude given by the number of counts. L corresponds to the total number of trial periods Pℓ or number of iterations. For this particular case, L = 3, M = 5, and N = 9. The PCA is computed for every ![]() , which returns (ℓ, m) eigenvalues and eigenvectors.
, which returns (ℓ, m) eigenvalues and eigenvectors.
Current usage metrics show cumulative count of Article Views (full-text article views including HTML views, PDF and ePub downloads, according to the available data) and Abstracts Views on Vision4Press platform.
Data correspond to usage on the plateform after 2015. The current usage metrics is available 48-96 hours after online publication and is updated daily on week days.
Initial download of the metrics may take a while.