Fig. 2
Download original image
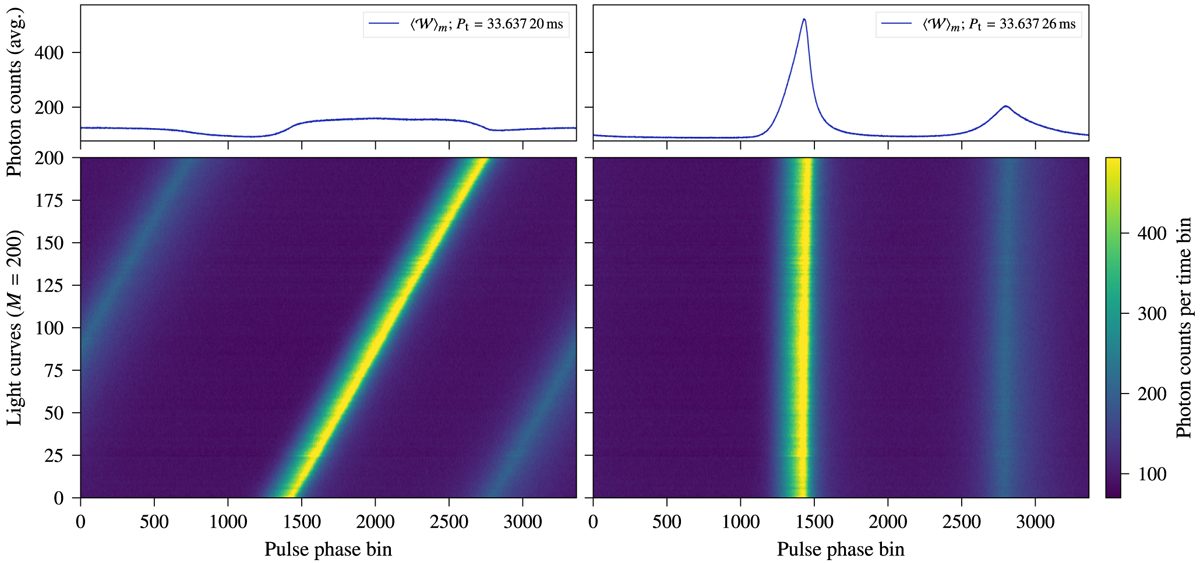
Waterfall diagram of a two-hour Crab pulsar acquisition OBS2 (Table 1). The two columns have the same datasets, same number of divisions (M = 200), and time bin (∆t = 10 µs), but different trial periods Pt. Left column: Pt = 33.637 20 ms, and the right column has Pt = 33.637 26 ms, i.e., a difference of 60 ns. Top panels: average along the m-axis (number of divisions or number of light curves, ![]() of each waterfall matrix
of each waterfall matrix ![]() . Vertical straight lines appear only when the adopted period corresponds to the best estimate. In addition, a perfectly straight line may not be possible because we did not consider pulsar spin-down or other effects in this calculation.
. Vertical straight lines appear only when the adopted period corresponds to the best estimate. In addition, a perfectly straight line may not be possible because we did not consider pulsar spin-down or other effects in this calculation.
Current usage metrics show cumulative count of Article Views (full-text article views including HTML views, PDF and ePub downloads, according to the available data) and Abstracts Views on Vision4Press platform.
Data correspond to usage on the plateform after 2015. The current usage metrics is available 48-96 hours after online publication and is updated daily on week days.
Initial download of the metrics may take a while.