Fig. 19
Download original image
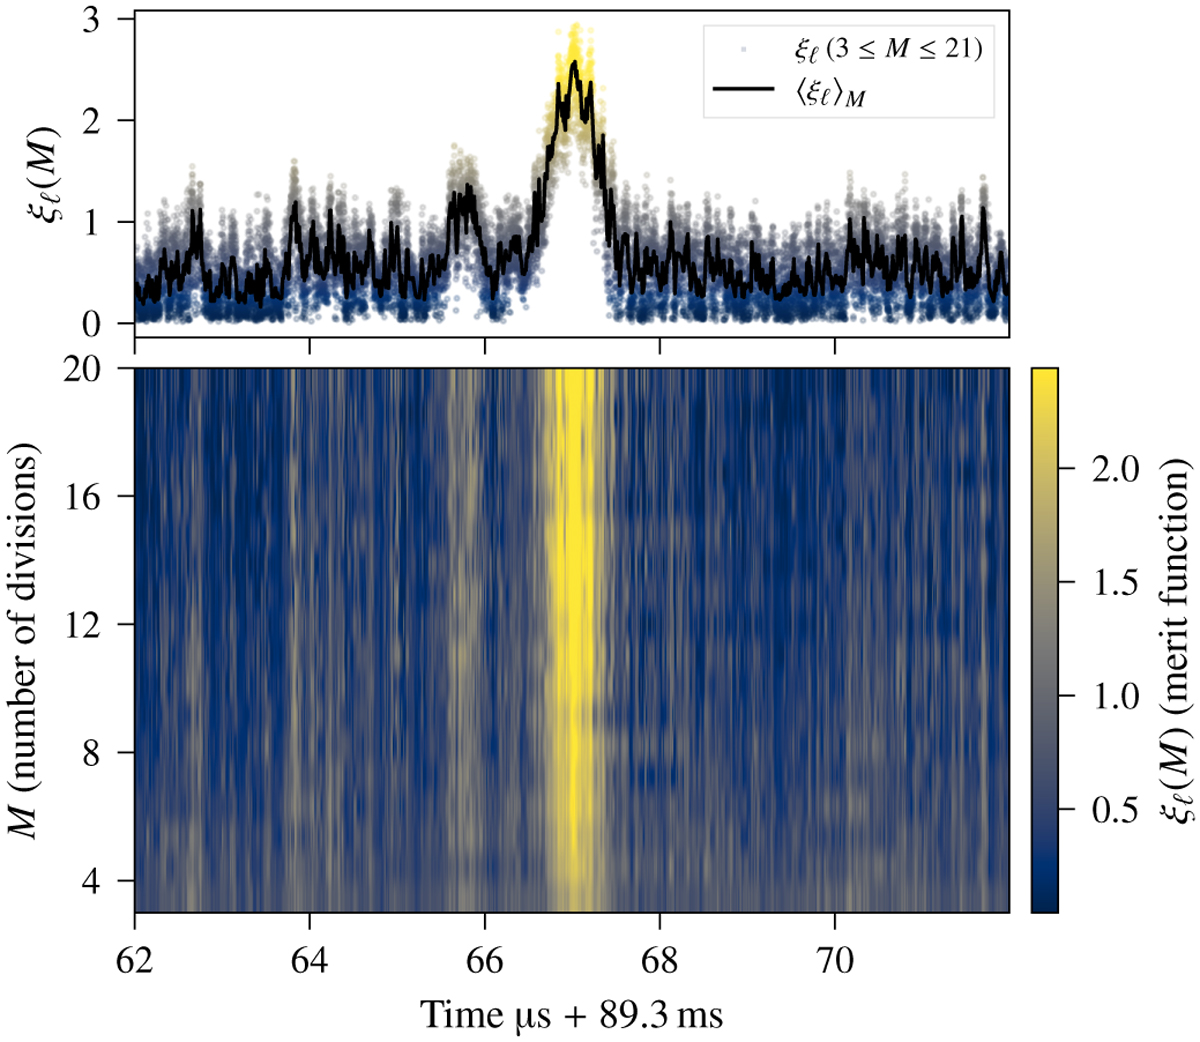
Amplitude of each waterfall-PCA folding merit function,ξℓ (M3)(color map rows). Top panel: average of all M values, 3 ≤ M ≤ 20, and it is then plotted as a solid line. A scatter plot of the original data is overplotted (with the same amplitude color bar). There is a clear noise reduction in the 〈ξℓ〉 M computed with Eq. (4). The case corresponds to the nominal Vela pulsar of 5.5 million counts. The solid line has a CPξ = 8.9 (Table 2). Some discrete merit functions (rows in the color map) are plotted in Fig. 17.
Current usage metrics show cumulative count of Article Views (full-text article views including HTML views, PDF and ePub downloads, according to the available data) and Abstracts Views on Vision4Press platform.
Data correspond to usage on the plateform after 2015. The current usage metrics is available 48-96 hours after online publication and is updated daily on week days.
Initial download of the metrics may take a while.