Fig. 15
Download original image
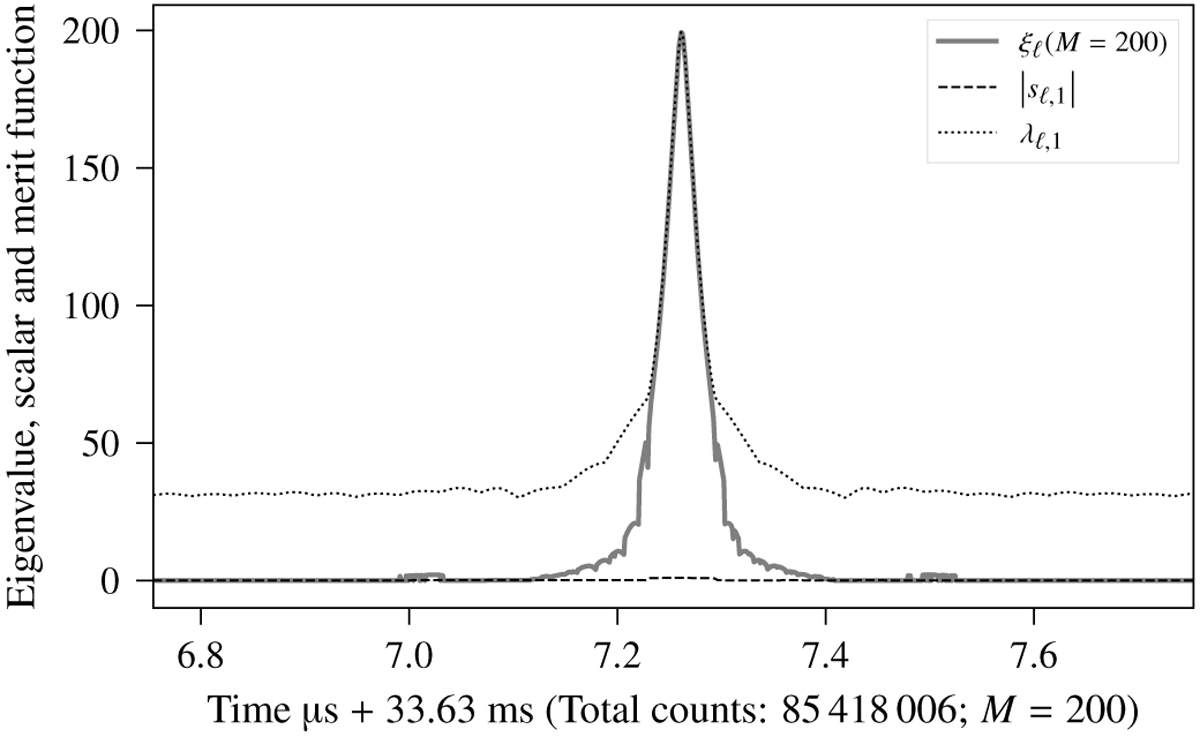
Construction of the waterfall-PCA folding merit function ξℓ (3) for M = 200 for the Crab pulsar observation. The plot shows three curves, the maximum scalar (1), the eigenvalue corresponding to the same sℓt,max (high signal-to-noise ratio case corresponds to the first PC eigenvalue), and the merit function ξℓ The strength in signal-to-noise ratio for an ideal pulsar observation is clear. The scalar, very low with respect to the rest (with 1 the maximum amplitude) of the curves, is plotted in Fig. 8. Eigenvalues from the same dataset are shown in Fig. 6.
Current usage metrics show cumulative count of Article Views (full-text article views including HTML views, PDF and ePub downloads, according to the available data) and Abstracts Views on Vision4Press platform.
Data correspond to usage on the plateform after 2015. The current usage metrics is available 48-96 hours after online publication and is updated daily on week days.
Initial download of the metrics may take a while.