Fig. 11
Download original image
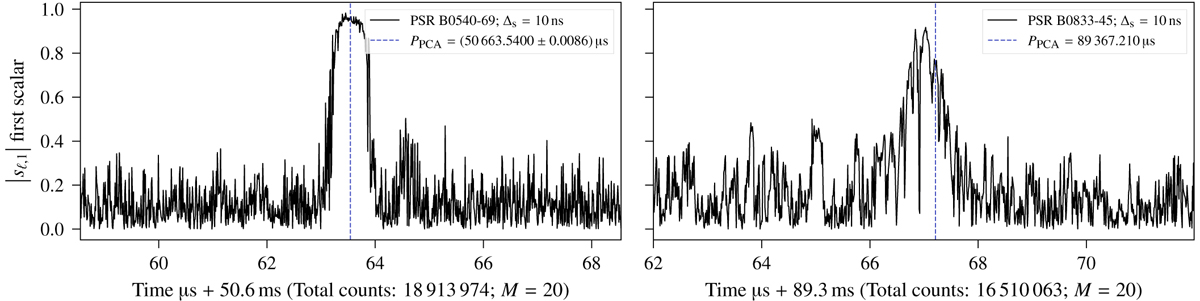
Absolute value of the scalar product, |sℓ,1|, of the first PC eigenvector and the hyperdiagonal unit vector as a function of the trial period. Left: PSR B0540-69, same data as in Fig. 9. Right: PSR B0833-45, same data as in Fig. 10. In both cases, the optimum period lies within the plateau region, or where the maximum, ~1 is achieved. The dashed vertical line corresponds to PPCA, the optimum value found by the first PC eigenvalue (from Figs. 9 and 10). The same behavior is shown in the high signal-to-noise ratio case for PSR B0531+21 in Fig. 8. The total time and observation data are stated in Table 1. eported periods by only taking the maxima reach very similar values. The difference between the two periods is ∆P = 120ns.
Current usage metrics show cumulative count of Article Views (full-text article views including HTML views, PDF and ePub downloads, according to the available data) and Abstracts Views on Vision4Press platform.
Data correspond to usage on the plateform after 2015. The current usage metrics is available 48-96 hours after online publication and is updated daily on week days.
Initial download of the metrics may take a while.