Fig. 10
Download original image
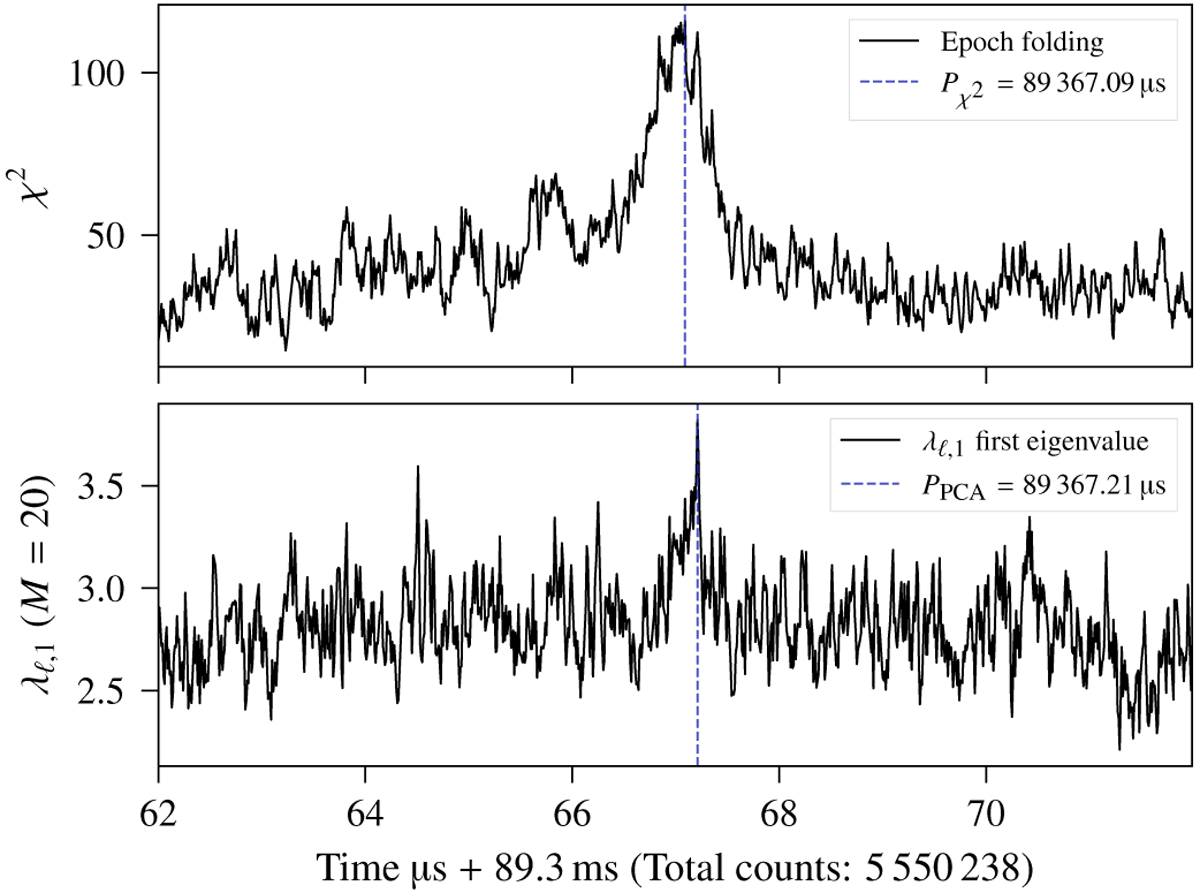
First eigenvalue compared to epoch folding for PSR B0833- 45. The top panel shows the χ2 optimization and the bottom panel the first PC eigenvalue for a waterfall ![]() with M = 20 number of divisions. Similarly as in Fig. 9, the noise level is higher in the first PC. The optimum peaks are close, and their difference is ∆P = |PPCA − Pχ2| = 120 ns. Both sets were started with the same initial conditions, ∆s = 10 ns, ∆t = 2.793 ms, number of iterations, and initial trial period.
with M = 20 number of divisions. Similarly as in Fig. 9, the noise level is higher in the first PC. The optimum peaks are close, and their difference is ∆P = |PPCA − Pχ2| = 120 ns. Both sets were started with the same initial conditions, ∆s = 10 ns, ∆t = 2.793 ms, number of iterations, and initial trial period.
Current usage metrics show cumulative count of Article Views (full-text article views including HTML views, PDF and ePub downloads, according to the available data) and Abstracts Views on Vision4Press platform.
Data correspond to usage on the plateform after 2015. The current usage metrics is available 48-96 hours after online publication and is updated daily on week days.
Initial download of the metrics may take a while.