Fig. 6
Download original image
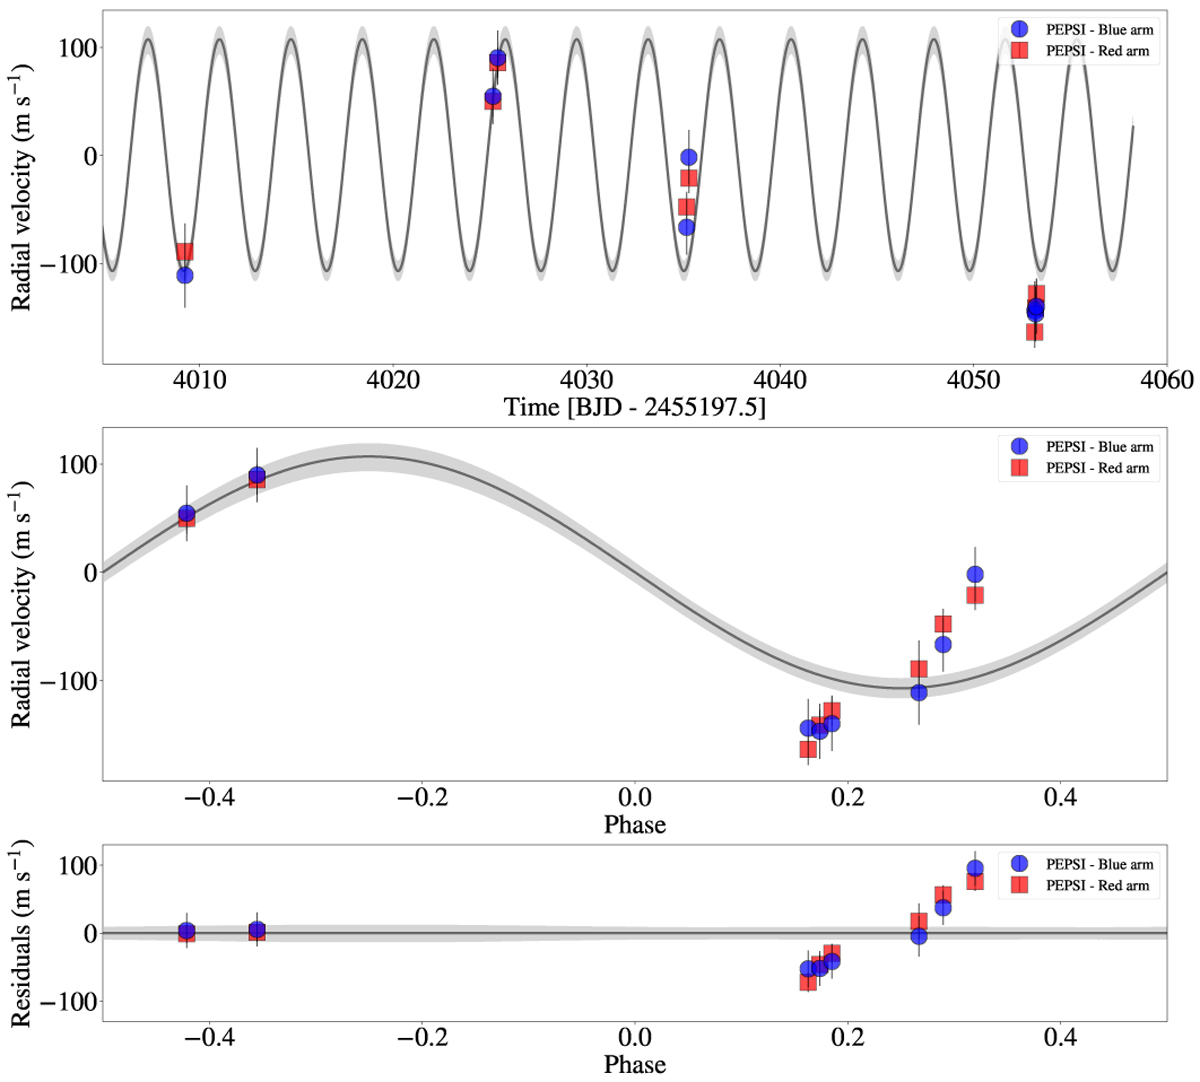
Gaia-2 RV. Top: PEPSI RV measurements of Gaia-2, on top of the best fitting RV curve (solid line) derived by Juliet. We subtracted the systemic velocity, which is listed in Table 4. Middle: phase-folded RV curves according to the period listed in Table 4. Bottom: residuals that show a possible systematic variation, perhaps due to some eccentricity of the orbit.
Current usage metrics show cumulative count of Article Views (full-text article views including HTML views, PDF and ePub downloads, according to the available data) and Abstracts Views on Vision4Press platform.
Data correspond to usage on the plateform after 2015. The current usage metrics is available 48-96 hours after online publication and is updated daily on week days.
Initial download of the metrics may take a while.