Fig. 7

Download original image
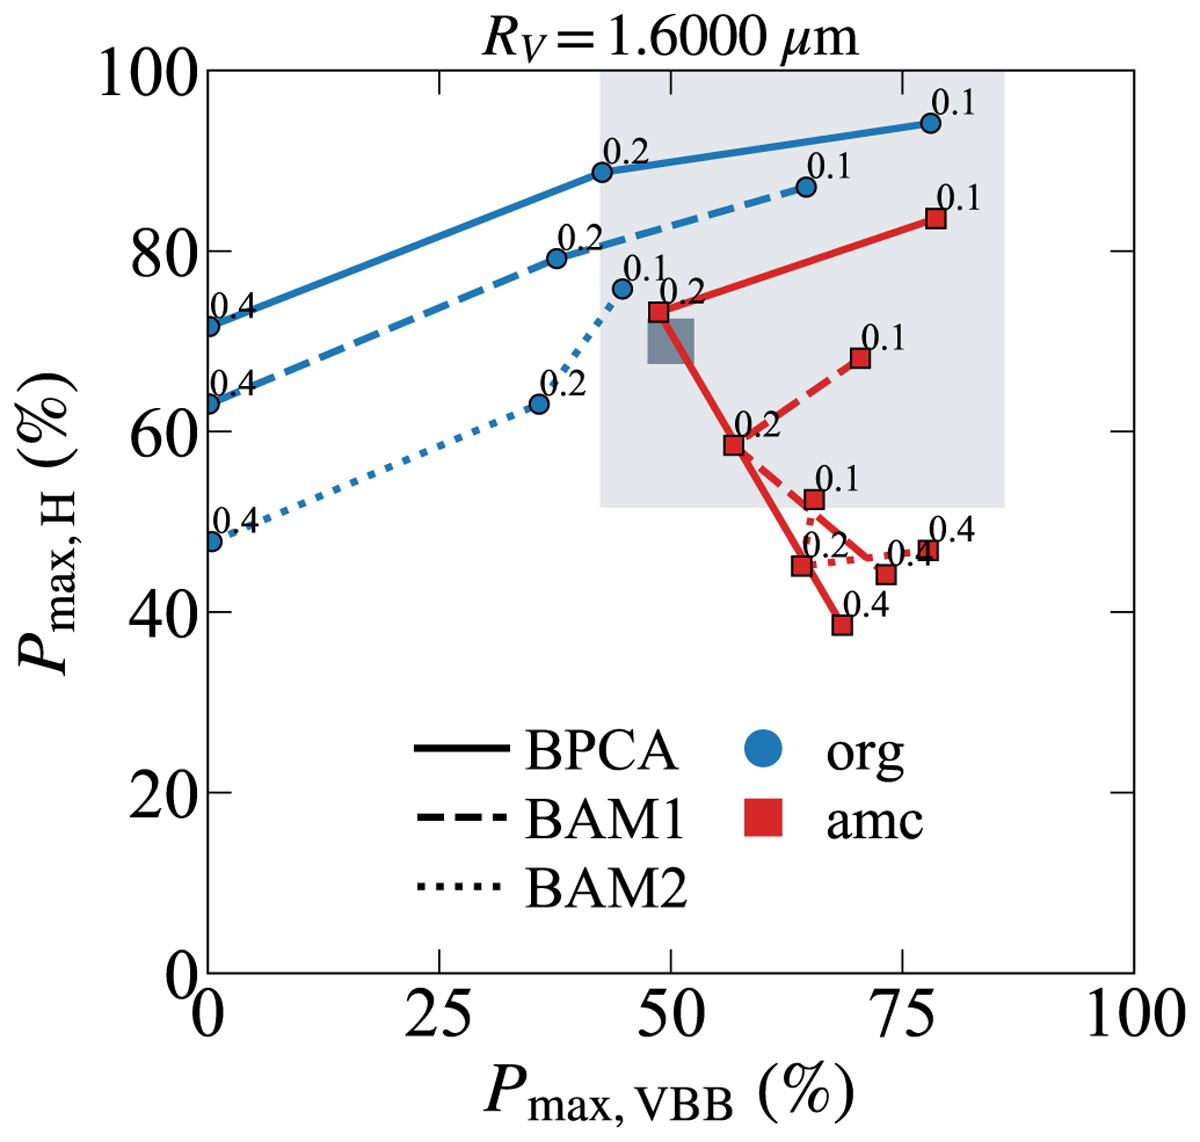
Maximum polarization of dust aggregates at the VBB (optical) and the H-band (near-IR) with RV = 1.6 μm. Different line styles correspond to different aggregate models (BPCA: solid, BAM1: dashed, BAM2: dotted lines), and different symbols correspond to different composition models (circles: org, squares: amc). The number beside each point denotes the monomer radius in unit of μm. The dark gray hatched area is the maximum polarization estimated by Hunziker et al. (2021), while the light gray hatched area is the estimated Pmax values for an assumed range of the single scattering albedo of 0.5−0.95.
Current usage metrics show cumulative count of Article Views (full-text article views including HTML views, PDF and ePub downloads, according to the available data) and Abstracts Views on Vision4Press platform.
Data correspond to usage on the plateform after 2015. The current usage metrics is available 48-96 hours after online publication and is updated daily on week days.
Initial download of the metrics may take a while.


