Fig. 4
Download original image
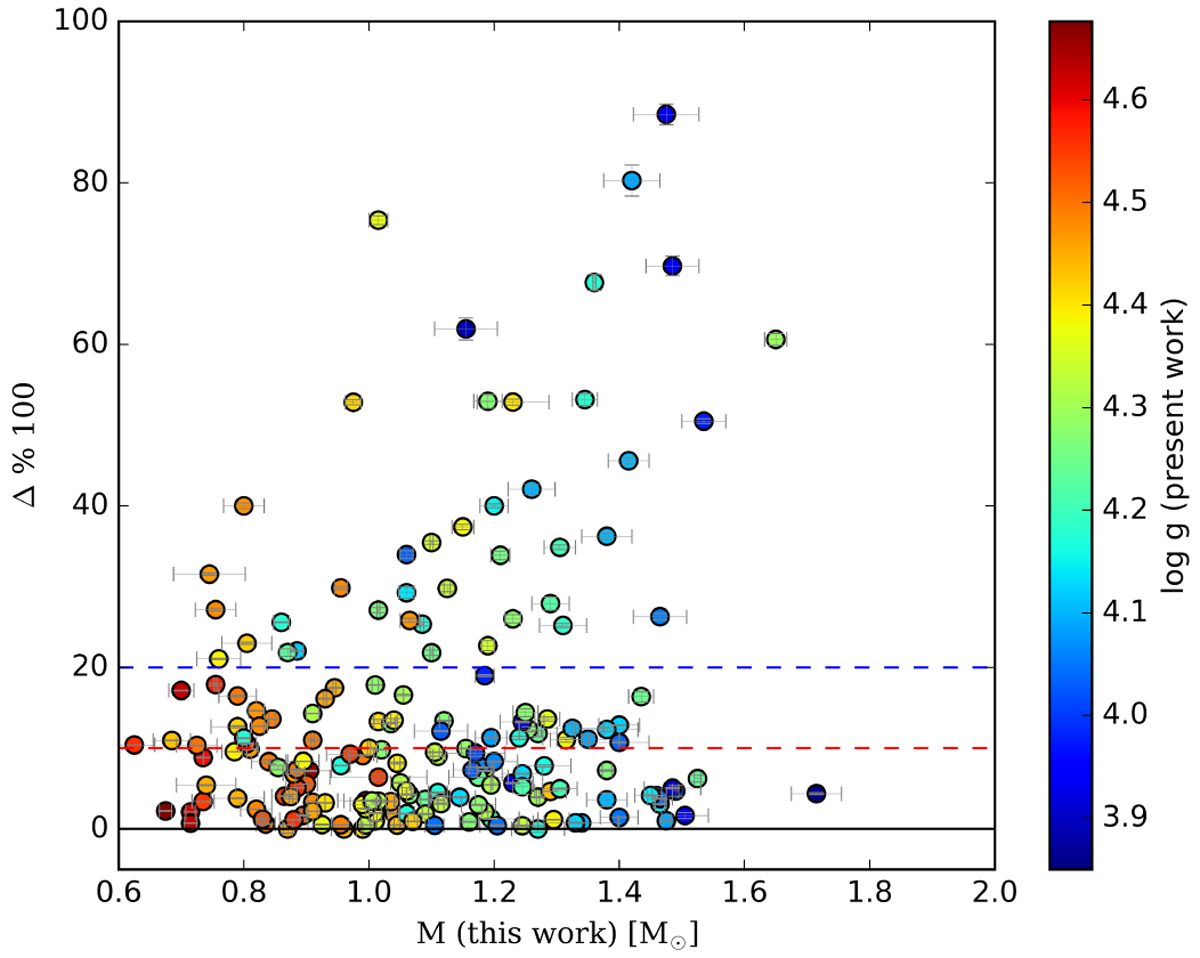
Relative difference between the literature stellar masses (from the NASA catalogue, or inferred values, see Chen & Kipping 2017, when the mass was not available) and the masses derived in the present work, as a function of the present work masses. The circles are colour-coded by the stellar surface gravity. The black continuous line indicates zero difference; the red line indicates a difference within 10% and the blue line within 20%.
Current usage metrics show cumulative count of Article Views (full-text article views including HTML views, PDF and ePub downloads, according to the available data) and Abstracts Views on Vision4Press platform.
Data correspond to usage on the plateform after 2015. The current usage metrics is available 48-96 hours after online publication and is updated daily on week days.
Initial download of the metrics may take a while.