Fig. 14
Download original image
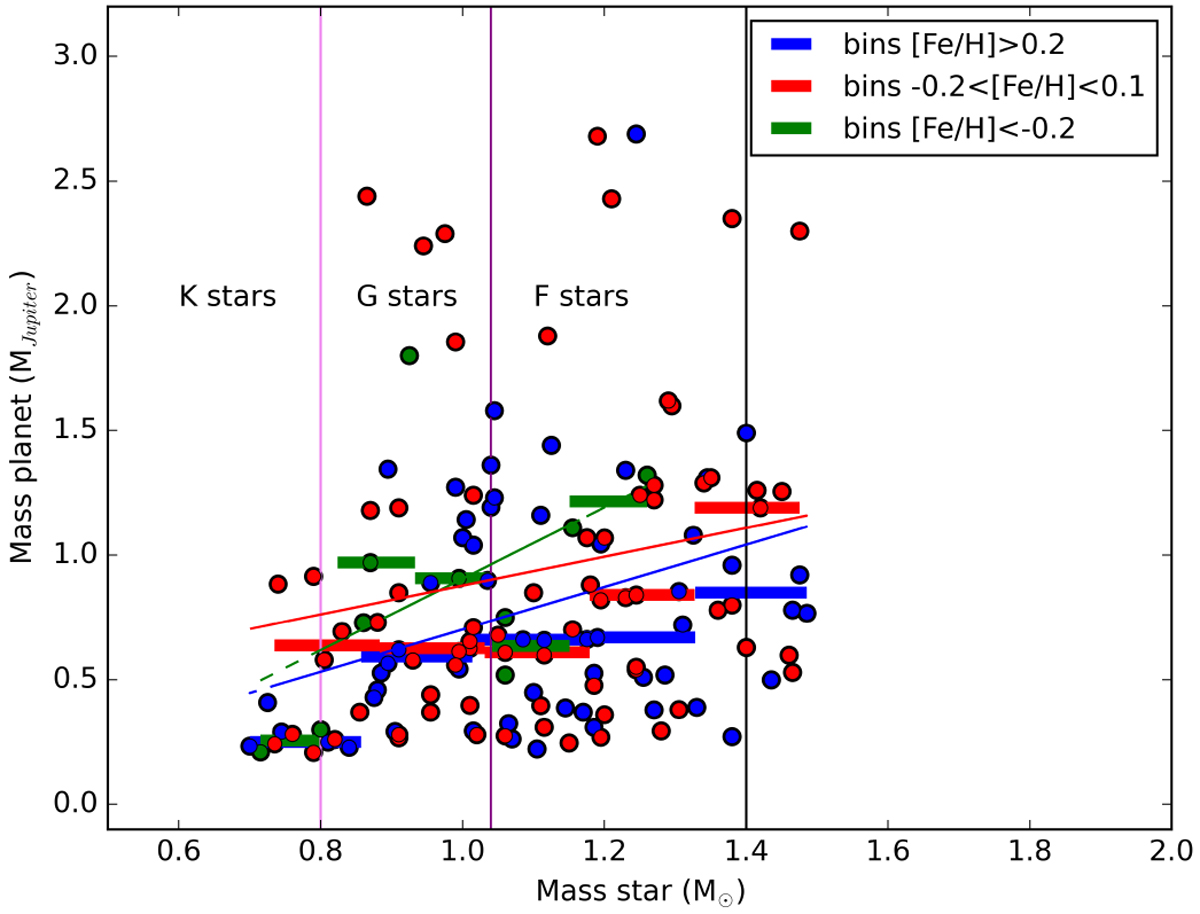
Planet mass as a function of stellar mass. Shown in blue are the super-solar metallicities ([Fe/H] > +0.2), in red the solar metallicities (−0.1 < [Fe/H] ≤ +0.2), and in green the sub-solar metallicities ([Fe/H] ≤ −0.1). The curves are the linear fits to the three datasets, colour-coded in the same way. The horizontal lines are the median values in each binned interval. The sub-Jovian planets have been excluded from the plot (see text). The three vertical lines show the approximate separations between the three spectral classes.
Current usage metrics show cumulative count of Article Views (full-text article views including HTML views, PDF and ePub downloads, according to the available data) and Abstracts Views on Vision4Press platform.
Data correspond to usage on the plateform after 2015. The current usage metrics is available 48-96 hours after online publication and is updated daily on week days.
Initial download of the metrics may take a while.