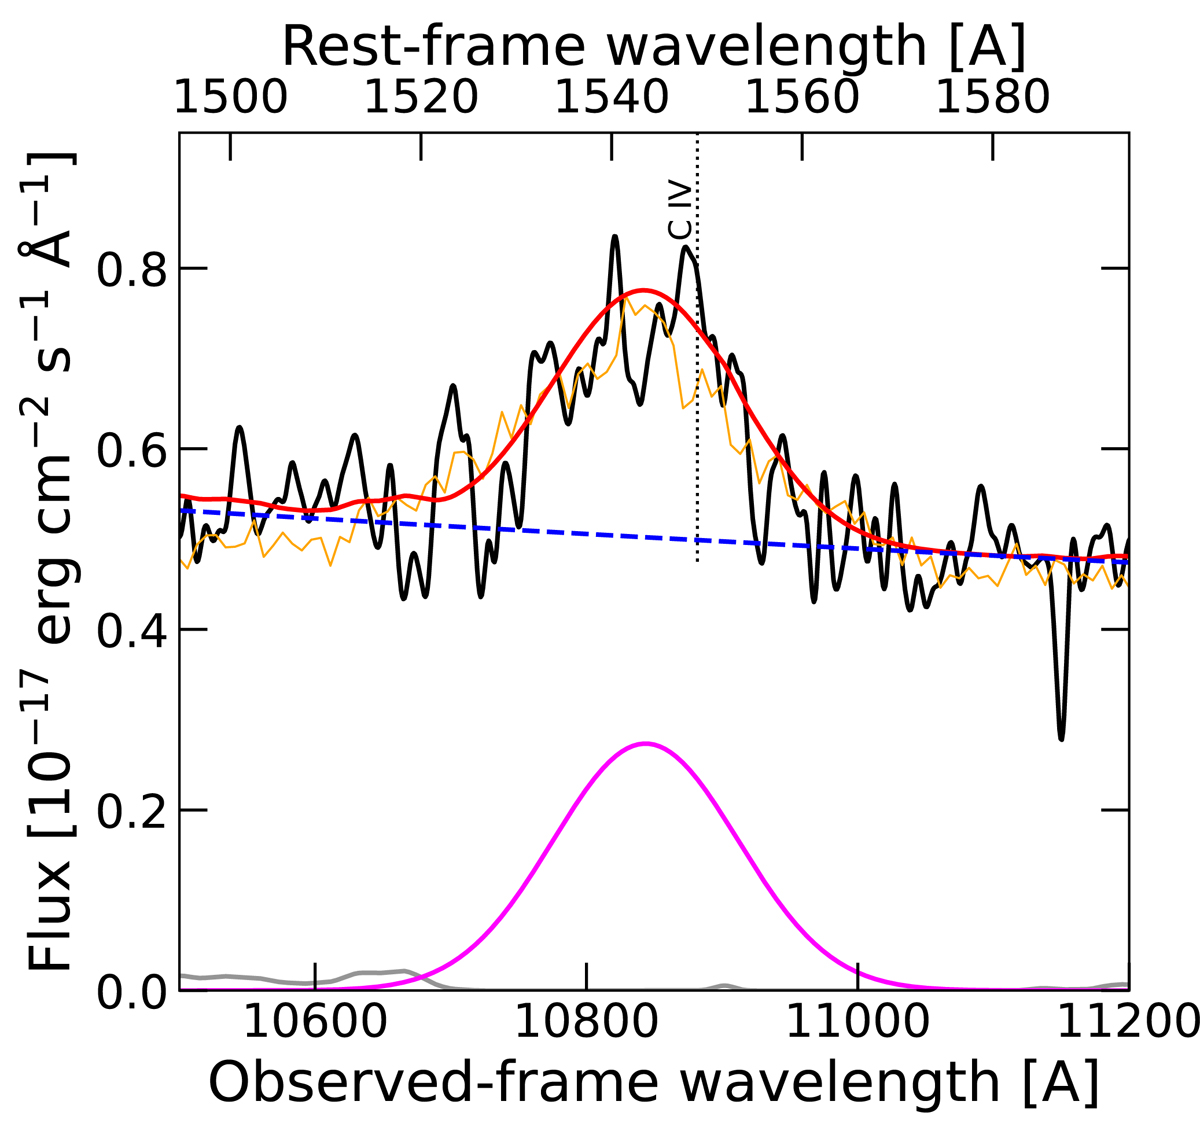
Fig. 7.
Download original image
Observed spectrum of the C IV emission-line region (black line) and best-fitting model (red line). The best-fitting individual components are also shown: the dashed blue line is the combined intrinsic continuum and Balmer pseudo-continuum model; the magenta line is the Gaussian component; and the gray line is the iron pseudo-continuum. For reference, the orange line represents the composite spectrum of z > 5.7 QSOs of Shen et al. (2019), and the vertical dashed line marks the expected location of the C IV emission line assuming the systemic redshift of z = 6.025. The observed blueshift of ≈1000 km s−1 is consistent with typical values of z > 6 QSOs.
Current usage metrics show cumulative count of Article Views (full-text article views including HTML views, PDF and ePub downloads, according to the available data) and Abstracts Views on Vision4Press platform.
Data correspond to usage on the plateform after 2015. The current usage metrics is available 48-96 hours after online publication and is updated daily on week days.
Initial download of the metrics may take a while.