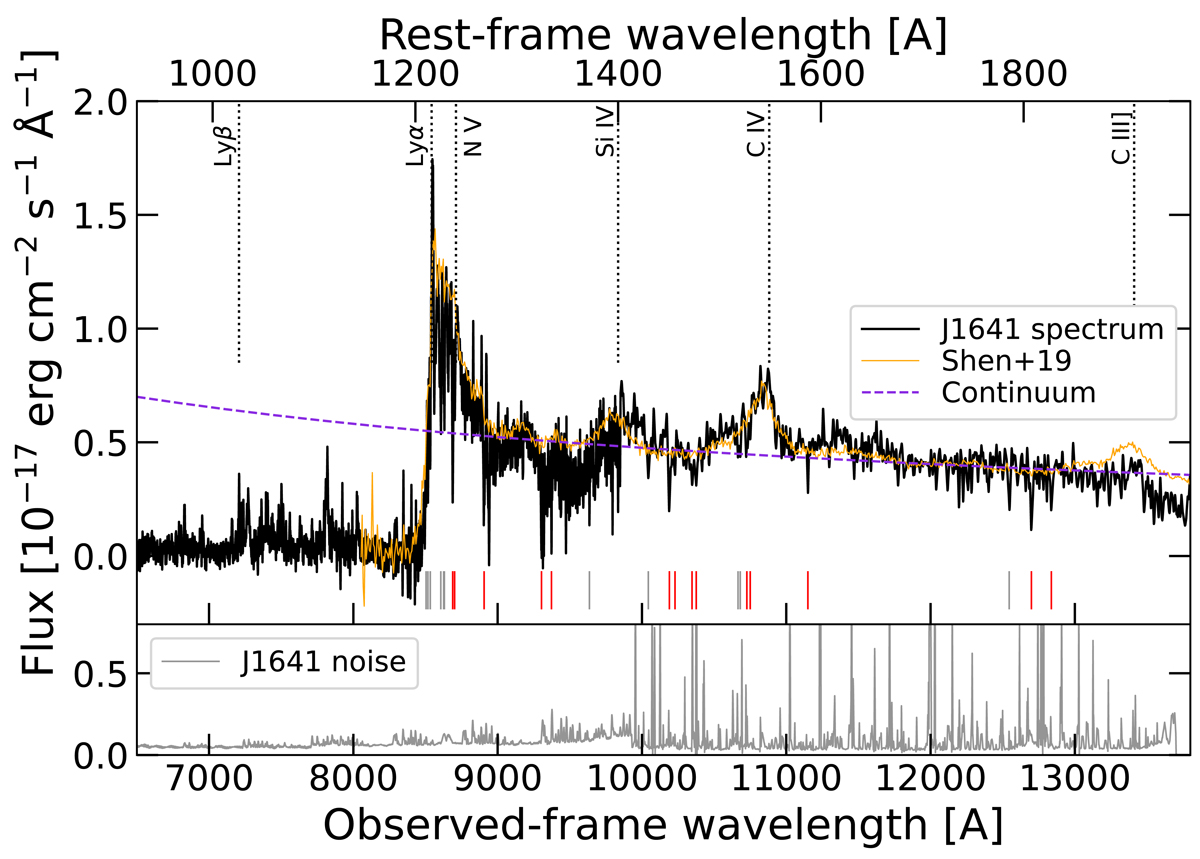
Fig. 5.
Download original image
Upper panel: combined LBT/MODS and LBT/LUCI spectra of J1641, smoothed with a Gaussian function with a standard deviation equal to the instrument wavelength resolutions (black line). We also show the composite spectrum of z > 5.7 QSOs of Shen et al. (2019, orange line), renormalized at rest-frame 1700 Å. The expected locations of emission lines at the measured redshift of J1641+3755 (i.e., 6.025) are marked as vertical dashed lines. The dashed violet line represents the best-fitting power-law continuum. Several narrow absorption lines are found in the spectrum: their locations are marked with short vertical ticks (see Table 5 and Fig. 6). We identified some of the absorption features with transitions due to an intervening system at z ≈ 5.67 (red ticks), while others are currently unidentified (gray ticks). Lower panel: error of the spectrum.
Current usage metrics show cumulative count of Article Views (full-text article views including HTML views, PDF and ePub downloads, according to the available data) and Abstracts Views on Vision4Press platform.
Data correspond to usage on the plateform after 2015. The current usage metrics is available 48-96 hours after online publication and is updated daily on week days.
Initial download of the metrics may take a while.