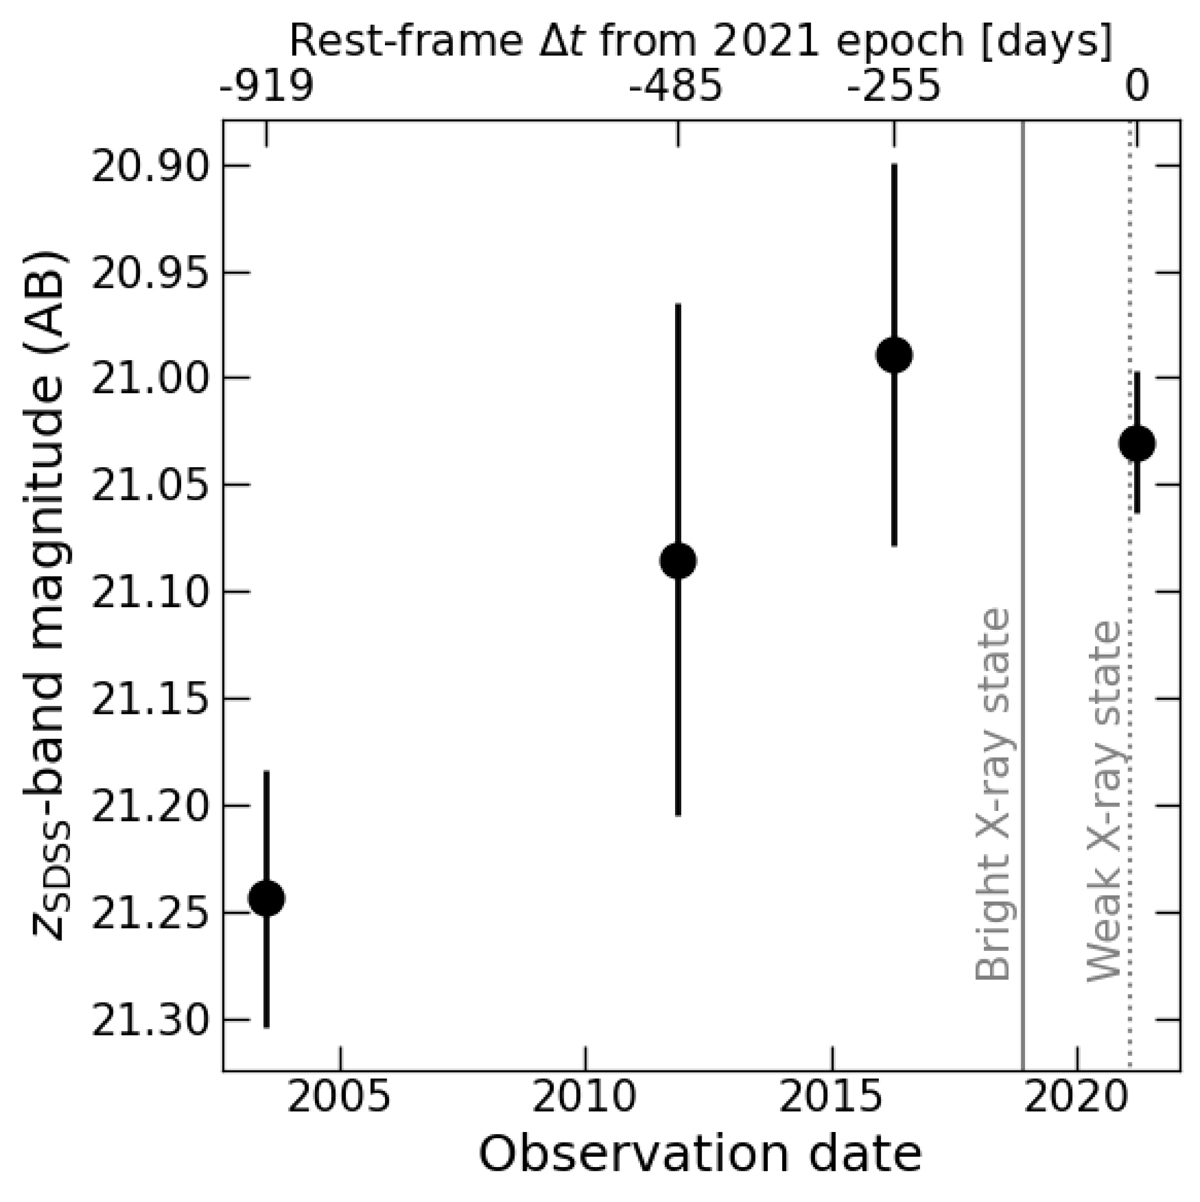
Fig. 4.
Download original image
Apparent magnitude in the z band as a function of the observation date. We compare our new LBT/LBC measurement in 2021, with magnitudes derived from the CFHT Legacy Survey, PanSTARRS PS1, and MzLS datasets (2003, 2011, and 2016, respectively). The solid vertical line marks the time of the 2018 Chandra observation, which detected bright X-ray emission from J1641+3755, while the dashed vertical line marks the time of the 2021 XMM-Newton observation that did not detect the QSO.
Current usage metrics show cumulative count of Article Views (full-text article views including HTML views, PDF and ePub downloads, according to the available data) and Abstracts Views on Vision4Press platform.
Data correspond to usage on the plateform after 2015. The current usage metrics is available 48-96 hours after online publication and is updated daily on week days.
Initial download of the metrics may take a while.