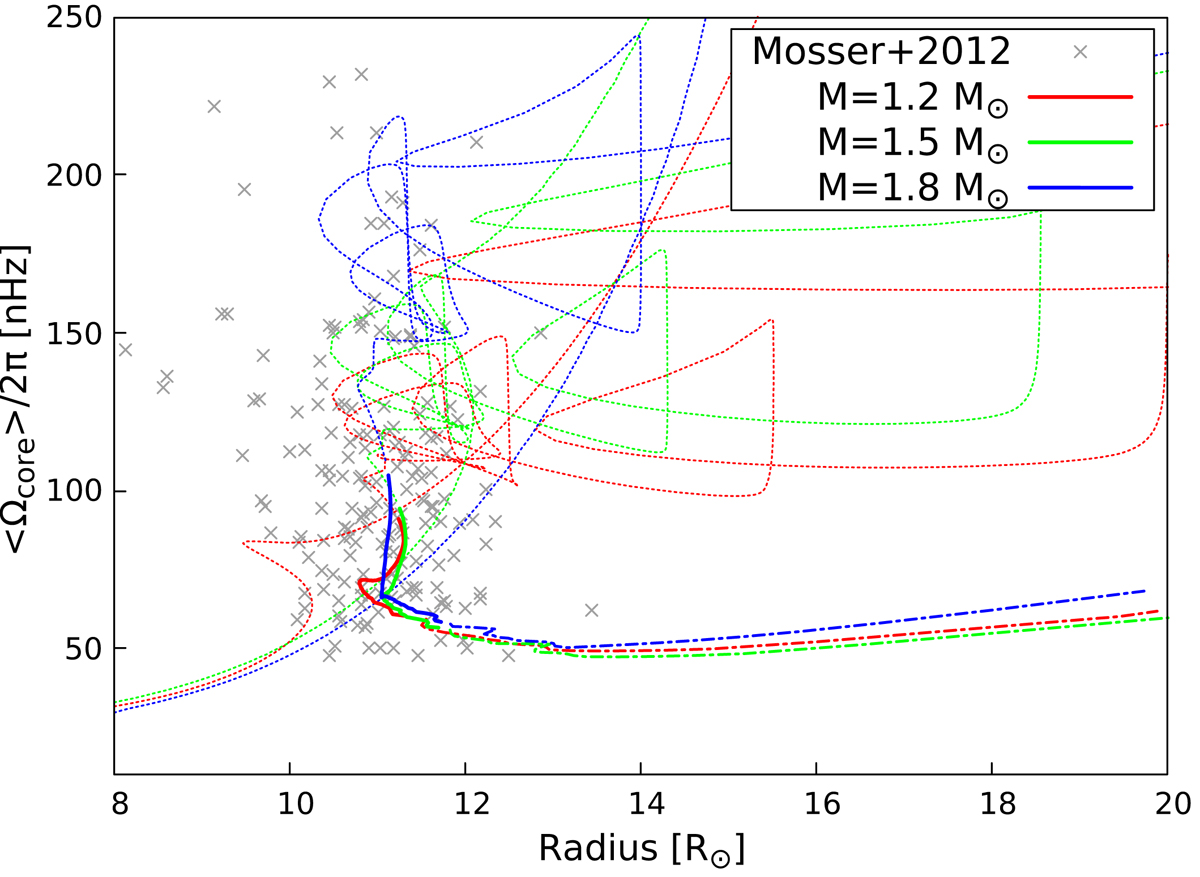
Fig. 11.
Download original image
Same as Fig. 10, but for models with different initial masses, as indicated in the legend. We show only the region around the stable core-helium burning phase. All models have an additional viscosity of νadd = 5 × 105 cm2 s−1. The data points correspond to red clump stars from Mosser et al. (2012). Dotted lines: before stable core-helium burning. Solid lines: long and stable core-helium burning phase (see text). Dash-dotted lines: last fraction of the stable core-helium burning phase.
Current usage metrics show cumulative count of Article Views (full-text article views including HTML views, PDF and ePub downloads, according to the available data) and Abstracts Views on Vision4Press platform.
Data correspond to usage on the plateform after 2015. The current usage metrics is available 48-96 hours after online publication and is updated daily on week days.
Initial download of the metrics may take a while.