Fig. 10.
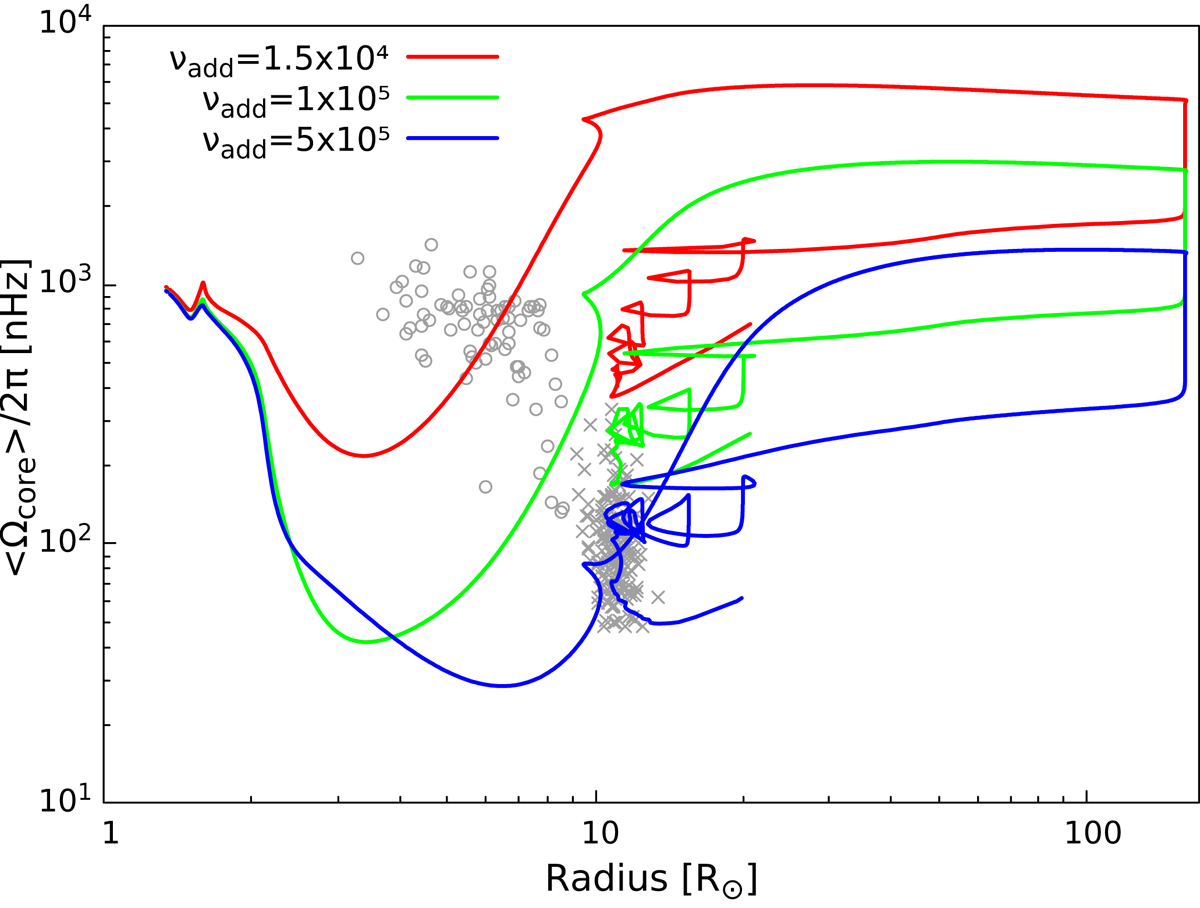
Download original image
Evolution of the core rotation rate as a function of the stellar radius. All models have an initial mass of 1.2 M⊙ and an initial velocity of 5 km s−1 (Pini = 12 days) and were computed with qcrMESA. Different values for the additional viscosity are used in each model, as indicated in the figure in units of cm2 s−1. The sharp drop in core rotation rate seen at R ∼ 150 R⊙ occurs because of the helium flash. The data correspond to red giants and red clump stars from Mosser et al. (2012). Only stars (data) with an estimated mass lower than M ≲ 2 M⊙ were included. Red clump stars are grouped at radii R ∼ 10 R⊙ (crosses), and red giants in the hydrogen-shell burning phase are located above this, with a higher core rotation rate and lower radii (circles).
Current usage metrics show cumulative count of Article Views (full-text article views including HTML views, PDF and ePub downloads, according to the available data) and Abstracts Views on Vision4Press platform.
Data correspond to usage on the plateform after 2015. The current usage metrics is available 48-96 hours after online publication and is updated daily on week days.
Initial download of the metrics may take a while.