Fig. 4.
Download original image
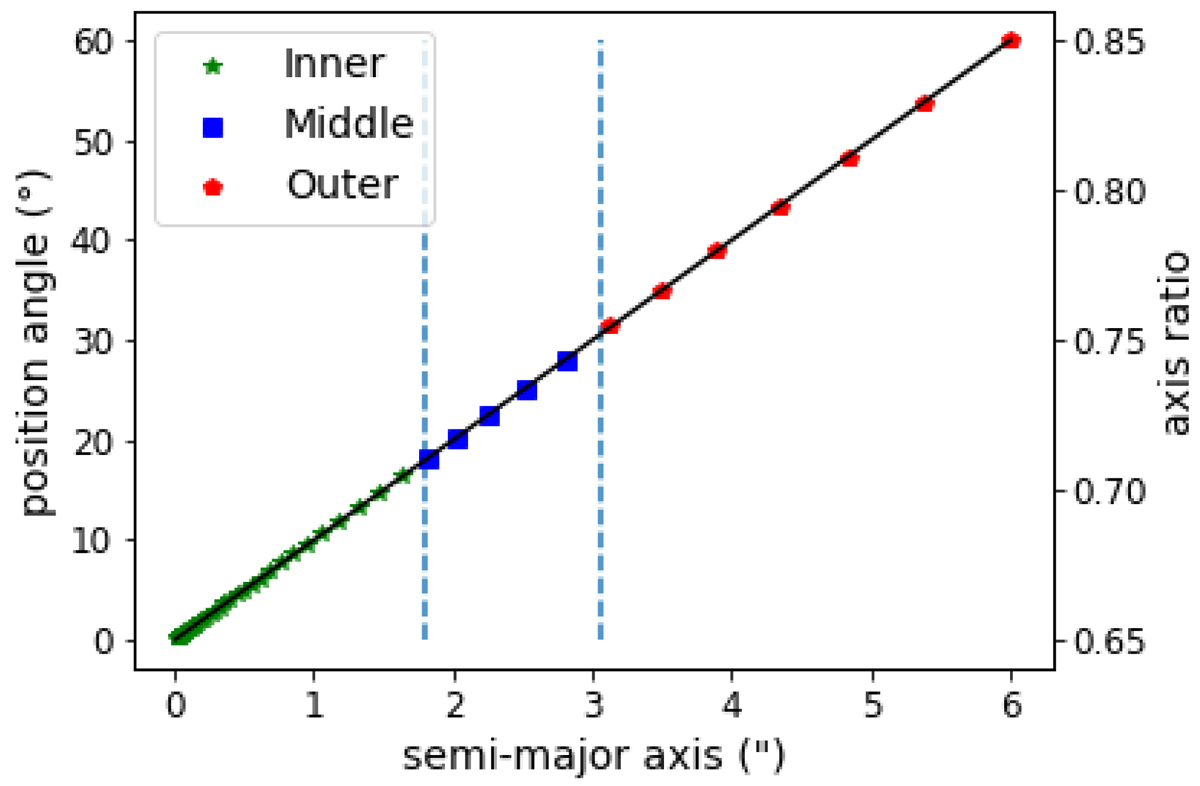
Slice properties of a fully varying profile in the monotonic azimuthal variations experiment, with either twists (left y-axis) or ellipticity gradient (right y-axis). The dashed vertical lines show from left to right the line at which the semi-major axis = 0.9 θE and the line at which the semi-minor axis = 1.1 θE, considering an Einstein radius of 2″. They separate the different regions considered for variations (see Sect. 2.2.2). The slices belonging to the different regions are represented with different colors and symbols.
Current usage metrics show cumulative count of Article Views (full-text article views including HTML views, PDF and ePub downloads, according to the available data) and Abstracts Views on Vision4Press platform.
Data correspond to usage on the plateform after 2015. The current usage metrics is available 48-96 hours after online publication and is updated daily on week days.
Initial download of the metrics may take a while.