Fig. 8
Download original image
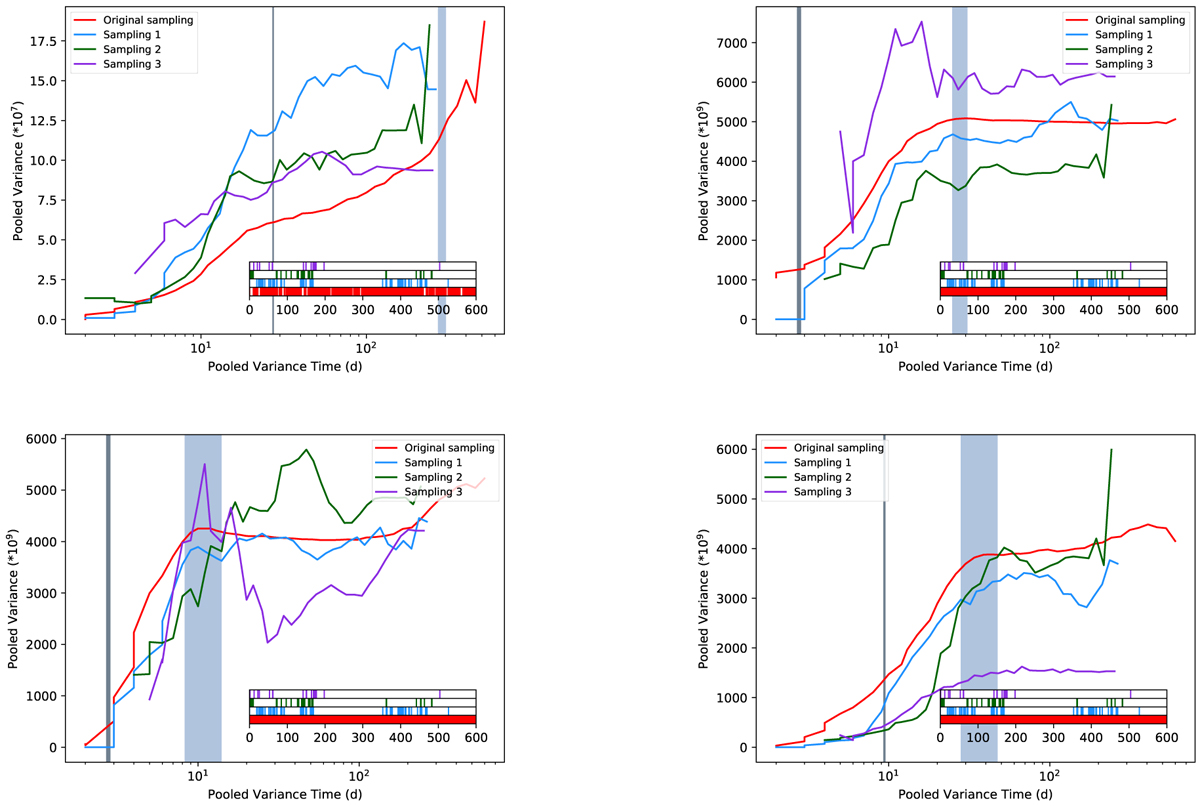
Pooled variance profile for the HARPS-N Solar S-index (up left), and simulated S-index time-series for different temporal samplings. The plot shows a smoothed function of the PV to improve the readability of the plots. The vertical lines show the simulated rotation periods and AR lifetimes. The inset plots show the temporal coverage of the different samplings.
Current usage metrics show cumulative count of Article Views (full-text article views including HTML views, PDF and ePub downloads, according to the available data) and Abstracts Views on Vision4Press platform.
Data correspond to usage on the plateform after 2015. The current usage metrics is available 48-96 hours after online publication and is updated daily on week days.
Initial download of the metrics may take a while.