Fig. 7
Download original image
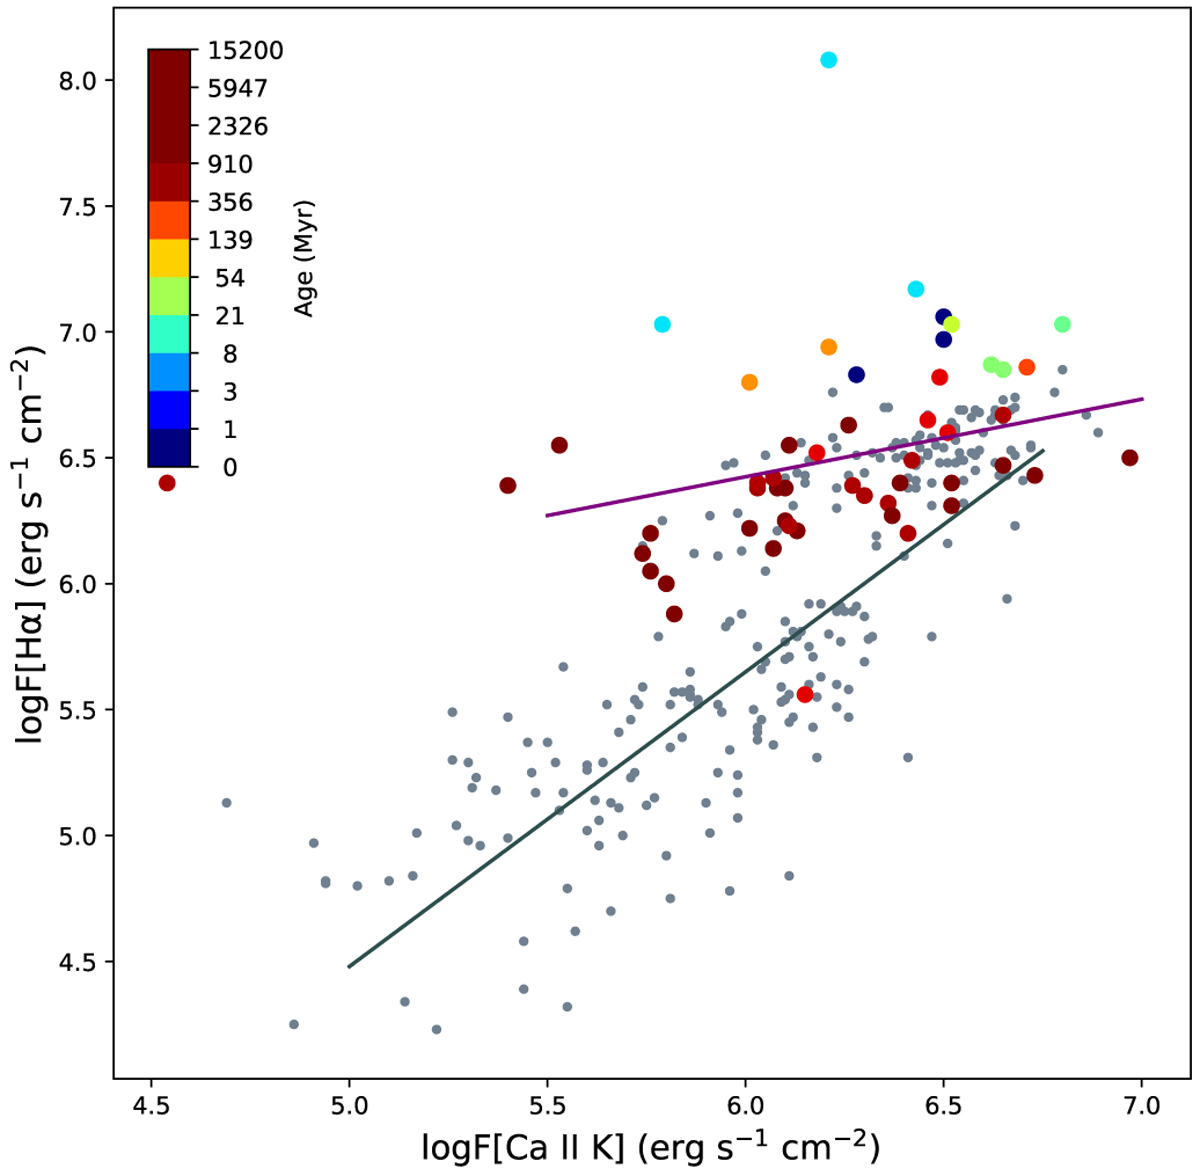
Flux–flux relationship between Hα and Ca II K. Different colours indicate the ages of the stars. For comparison, data for FGKM stars from the literature (López-Santiago et al. 2010; Martínez-Arnáiz et al. 2010) are also plotted as grey circles. Our best linear fit for the upper branch is shown with a purple line, while the grey line shows the fit for the lower branch derived by Martíez-Arnáiz et al. (2011b).
Current usage metrics show cumulative count of Article Views (full-text article views including HTML views, PDF and ePub downloads, according to the available data) and Abstracts Views on Vision4Press platform.
Data correspond to usage on the plateform after 2015. The current usage metrics is available 48-96 hours after online publication and is updated daily on week days.
Initial download of the metrics may take a while.