Fig. 2
Download original image
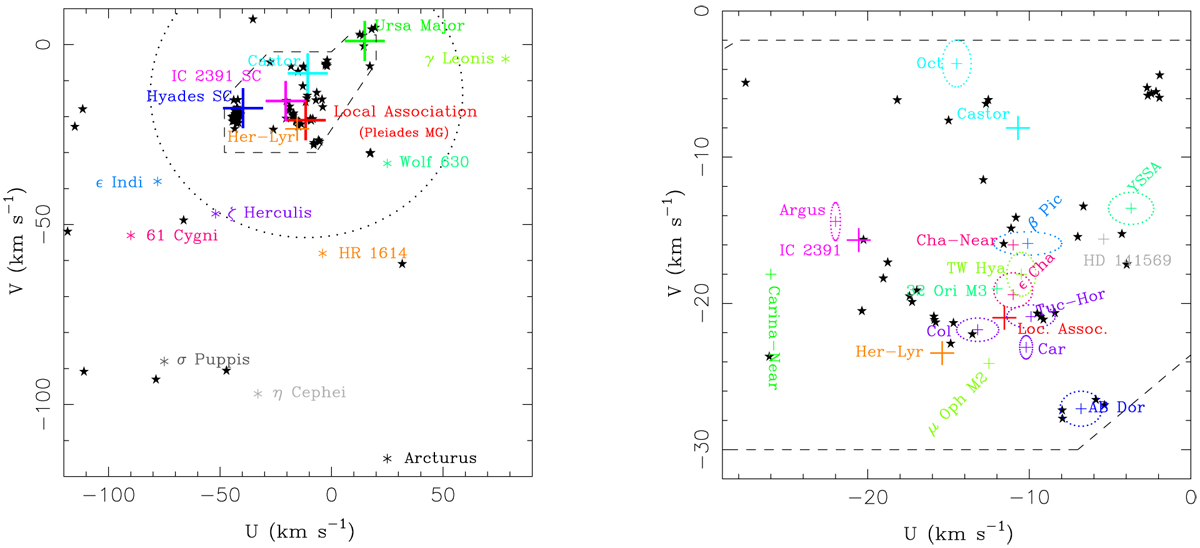
(U, V) plane for the observed stars. Left: (U, V) plane showing the position of the known kinematic groups in the solar neighbourhood. Large crosses represent the convergence point of the ‘classical’ moving groups. Coloured asterisks show the positions of the so-called ‘old’ moving groups. Our stars are shown by black filled star symbols. The dashed line represents the boundary of the young disc population as defined by Eggen (1984, Eggen 1989). The dotted line represents the velocity ellipsoid determined by Francis & Anderson (2009). Right: zoom onto the region of the (U, V) plane around the Local Association.
Current usage metrics show cumulative count of Article Views (full-text article views including HTML views, PDF and ePub downloads, according to the available data) and Abstracts Views on Vision4Press platform.
Data correspond to usage on the plateform after 2015. The current usage metrics is available 48-96 hours after online publication and is updated daily on week days.
Initial download of the metrics may take a while.