Fig. 10
Download original image
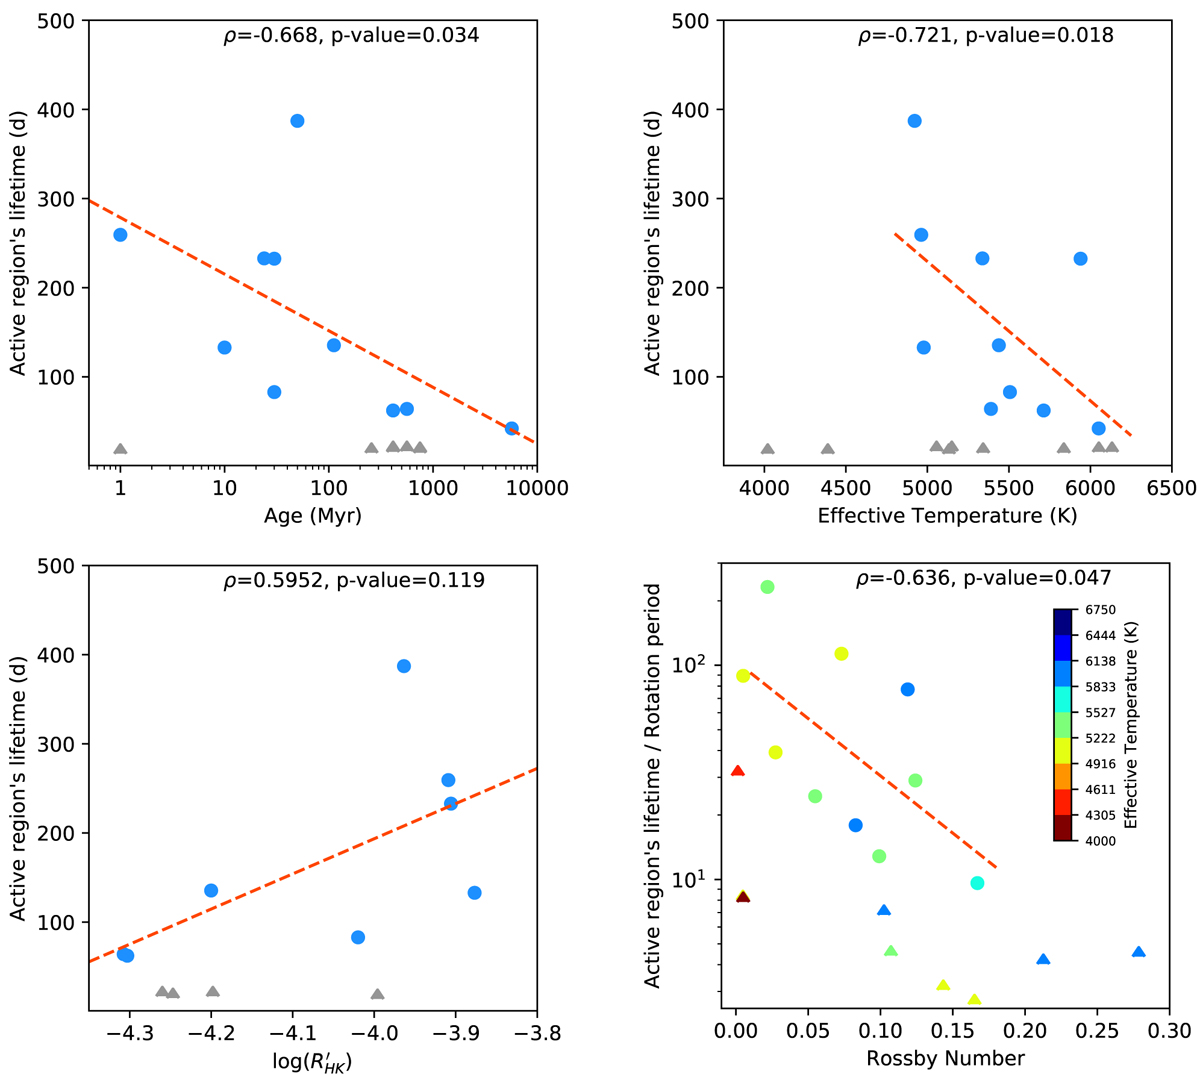
Timescale of AR evolution derived from the ACF analysis of the TESS light curves as a function of stellar age (top left), effective temperature (top right), log ![]() value (bottom left), and Rossby number (bottom right). Stars with lower limits on the AR timescale are shown with triangles. A linear fit (dashed orange-red line) is shown to guide the eye.
value (bottom left), and Rossby number (bottom right). Stars with lower limits on the AR timescale are shown with triangles. A linear fit (dashed orange-red line) is shown to guide the eye.
Current usage metrics show cumulative count of Article Views (full-text article views including HTML views, PDF and ePub downloads, according to the available data) and Abstracts Views on Vision4Press platform.
Data correspond to usage on the plateform after 2015. The current usage metrics is available 48-96 hours after online publication and is updated daily on week days.
Initial download of the metrics may take a while.