Fig. B.1
Download original image
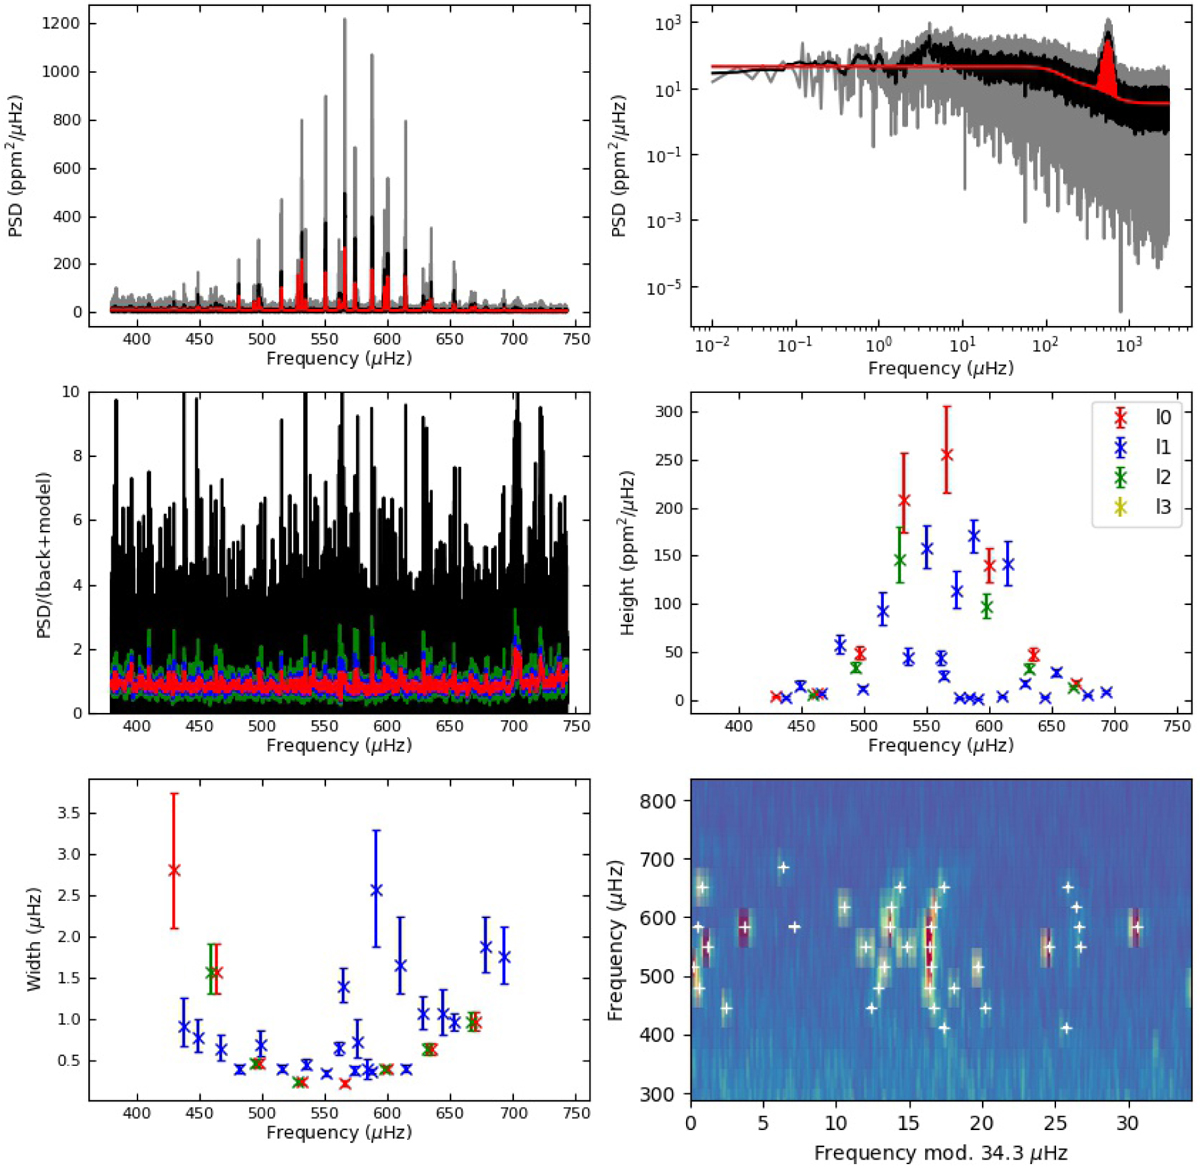
Summary of the peakbagging of the subgiant KIC 5723165. Top left: Original PSD as a function of frequency in a linear scale around vmax (grey), a smoothed PSD (black), and the resultant fit (red). Top right: Same three PSDs in a log-log scale. Central left: Residual of PSD (in S/N) after removing the fitted model. The coloured lines represent different levels of smoothing. Central right: Fitted mode heights as a function of frequency. Bottom left: Fitted mode widths as a function of frequency. Bottom right: Echelle diagram with a Δν of 34.3 µHz. Crosses indicate the fitted frequencies. This figure has been produced as one of apollinaire standard outputs.
Current usage metrics show cumulative count of Article Views (full-text article views including HTML views, PDF and ePub downloads, according to the available data) and Abstracts Views on Vision4Press platform.
Data correspond to usage on the plateform after 2015. The current usage metrics is available 48-96 hours after online publication and is updated daily on week days.
Initial download of the metrics may take a while.