Fig. 7
Download original image
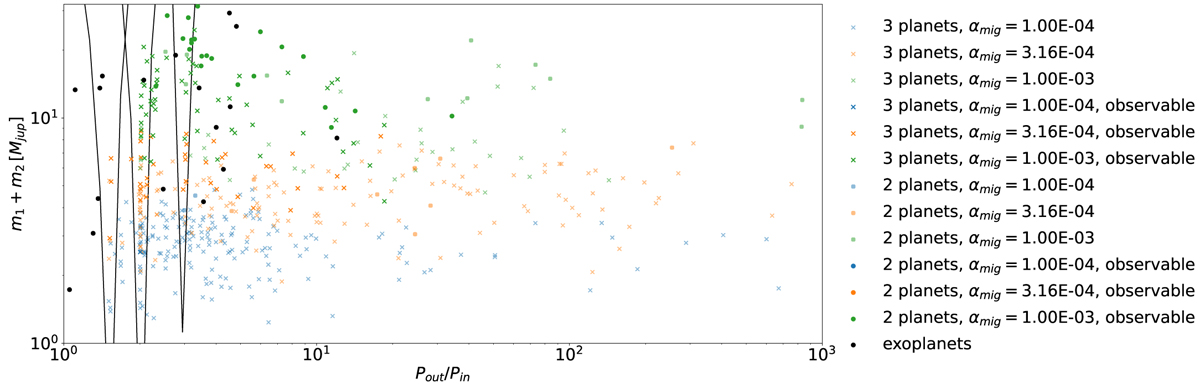
Final period ratios of all simulated planet pairs plotted against their combined mass. Crosses mark planet pairs in 3-planet systems and circles denote 2-planet systems, where the third planet collided or got ejected. The transparency of the markers indicates whether or not the pair would be observable with current standard radial velocity measurements. The different colors denote the α viscosity value of the protoplanetary disk with blue, orange and green for α = 10−4, 3.16 × 10⁻⁴, and 10−3, respectively. The period ratios of known exoplanet pairs around stars with luminosities exceeding 5 L⊙ are marked with black dots. The horn-shaped black solid curves indicate the approximate resonance boundaries ![]() for a p:q mean motion resonance, in this case for 3:2, 2:1, and 3:1 resonances. It is evident that period ratios close to the 2:1 mean motion resonance occur frequently for all α viscosity values. But since for the lower two α viscosity values the distances to the star are typically larger only few of the resonant pairs would be observable.
for a p:q mean motion resonance, in this case for 3:2, 2:1, and 3:1 resonances. It is evident that period ratios close to the 2:1 mean motion resonance occur frequently for all α viscosity values. But since for the lower two α viscosity values the distances to the star are typically larger only few of the resonant pairs would be observable.
Current usage metrics show cumulative count of Article Views (full-text article views including HTML views, PDF and ePub downloads, according to the available data) and Abstracts Views on Vision4Press platform.
Data correspond to usage on the plateform after 2015. The current usage metrics is available 48-96 hours after online publication and is updated daily on week days.
Initial download of the metrics may take a while.