Fig. 6
Download original image
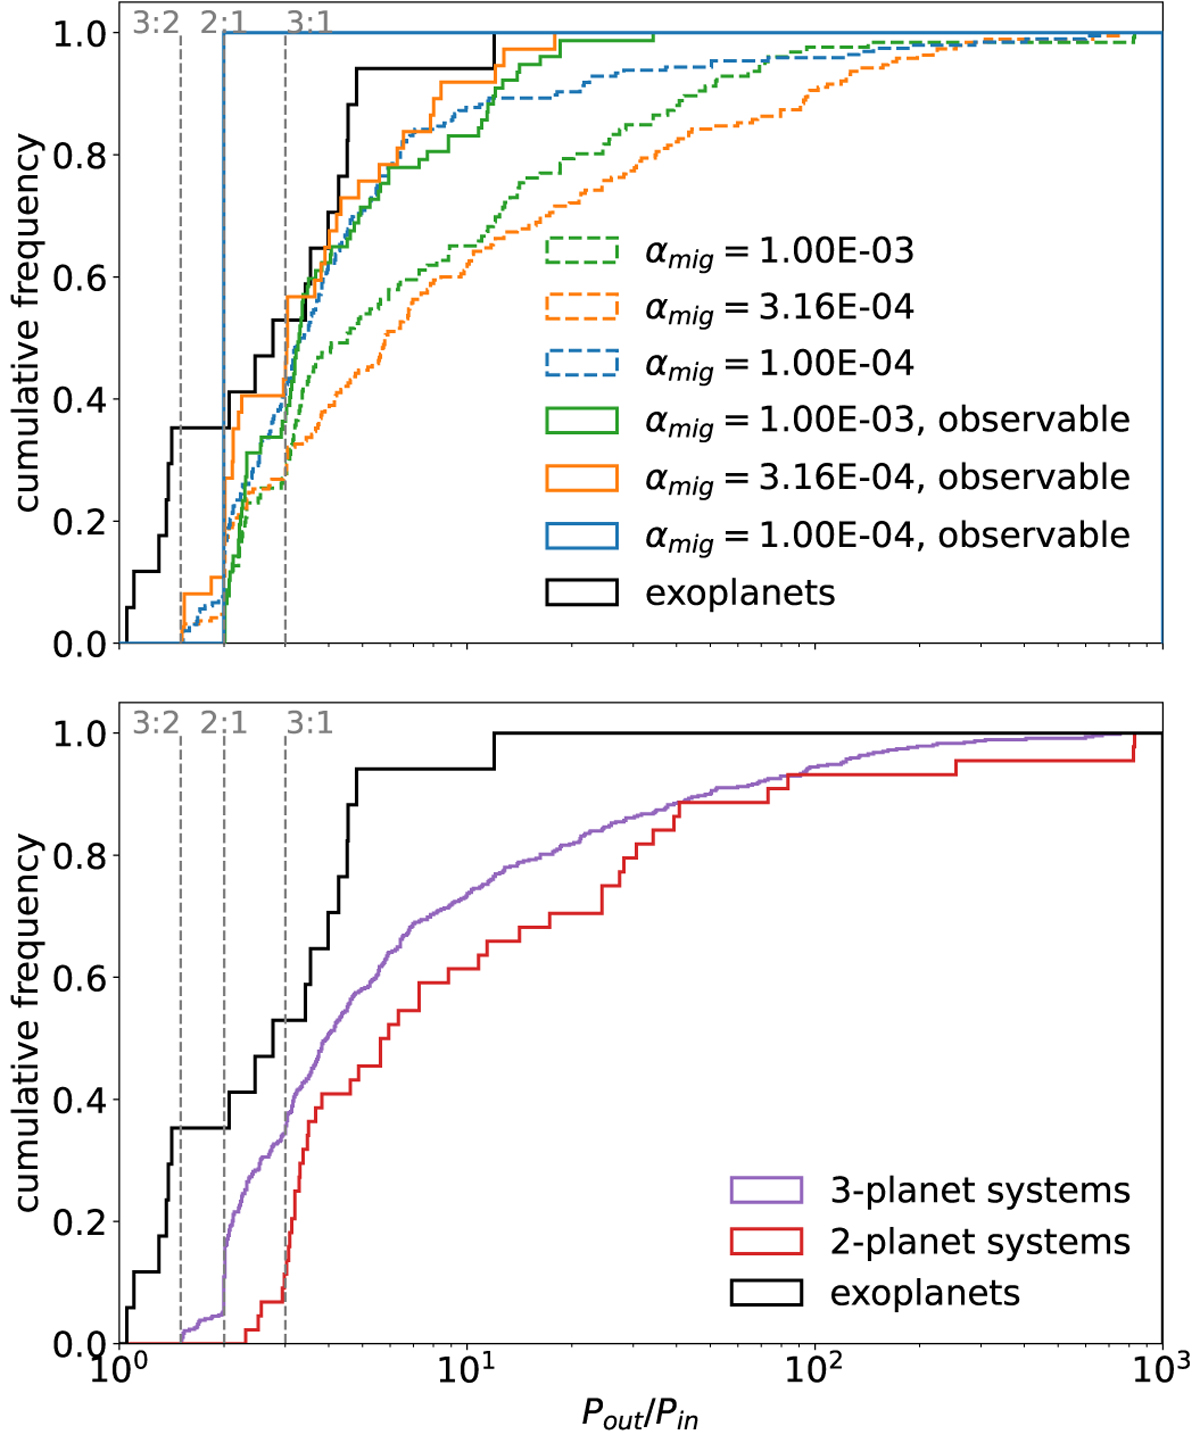
Normalized cumulative distribution function of the period ratios among simulated planet pairs. In the upper panel, the period ratio distributions of simulations with α viscosity values 10−4, 3.16 × 10⁻⁴, and 10−3, are depicted in blue, orange and green, respectively. Dashed lines indicate the period ratios among all adjacent planet pairs, whereas period ratios of those planet pairs that would hypothetically be observable are shown as solid lines. The lower panel compares the period ratio distribution of planets in 2- (purple) and 3-planet systems (red). We observe a significant pile-up of period ratios near the 2:1 resonance for 3-planet systems and around the 3:1 resonance for 2-planet systems.
Current usage metrics show cumulative count of Article Views (full-text article views including HTML views, PDF and ePub downloads, according to the available data) and Abstracts Views on Vision4Press platform.
Data correspond to usage on the plateform after 2015. The current usage metrics is available 48-96 hours after online publication and is updated daily on week days.
Initial download of the metrics may take a while.