Fig. 5
Download original image
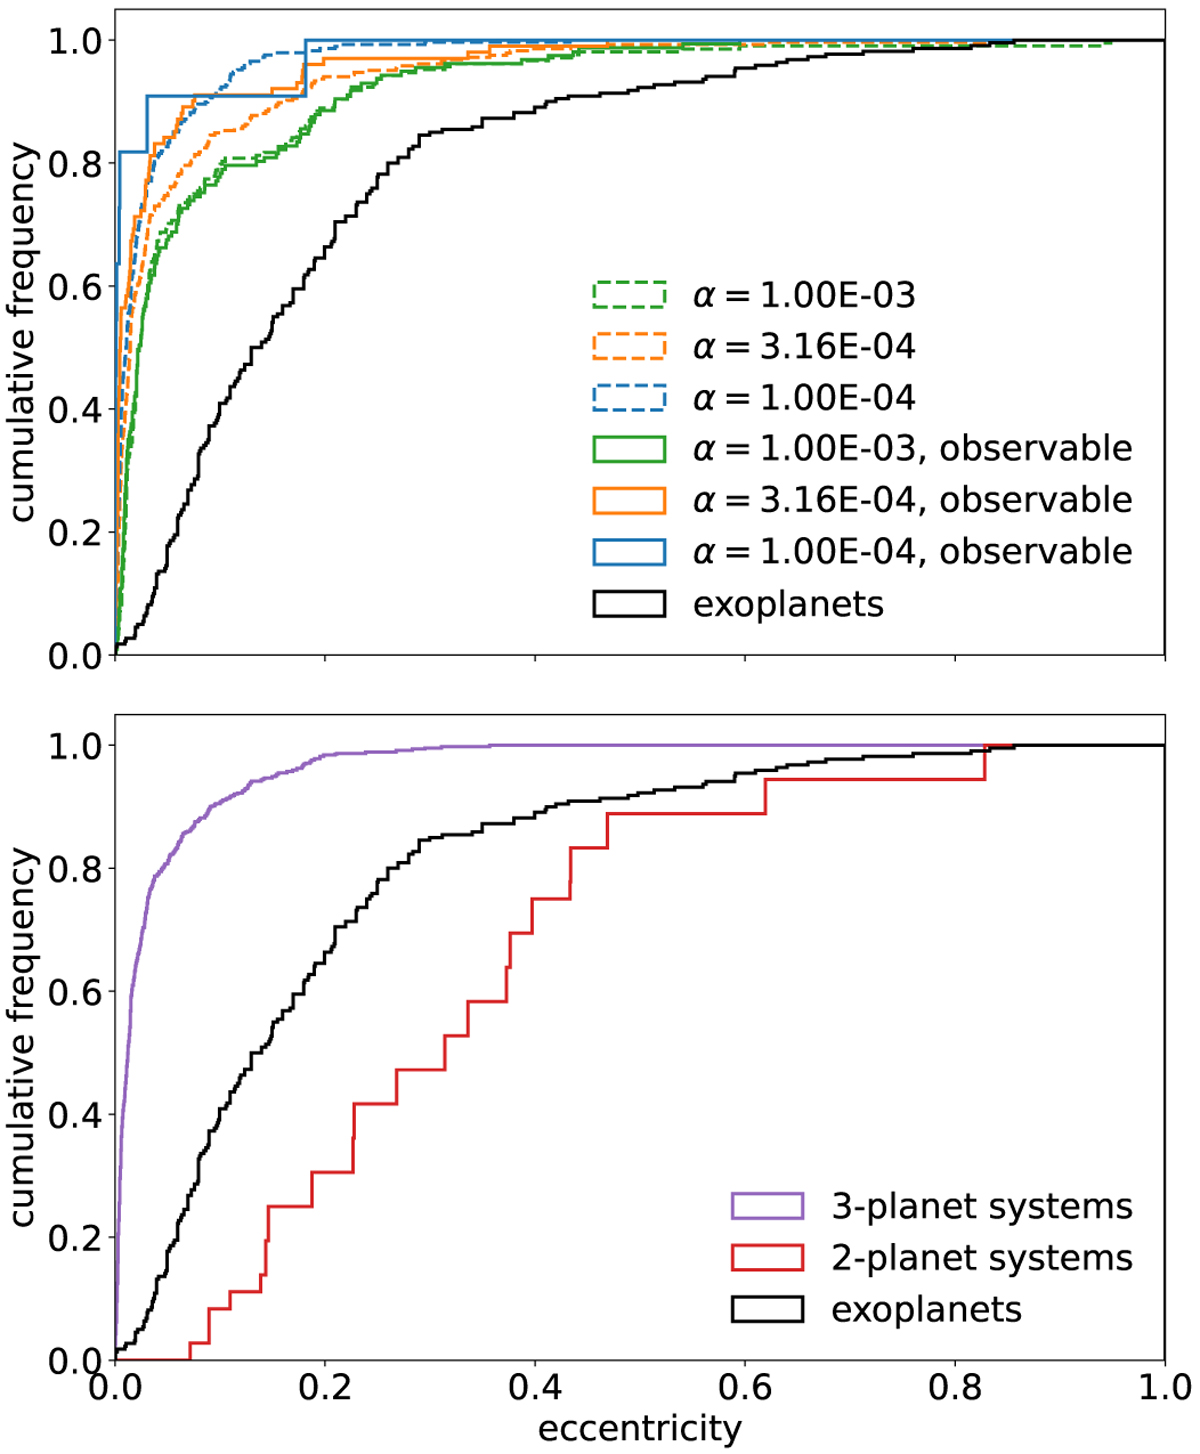
Cumulative histogram of the eccentricity distribution among the simulated planet population. In the upper panel, the normalized distributions of simulations with α viscosity values 10−4, 3.16 × 10⁻⁴, and 10−3, are depicted in blue, orange and green, respectively. Dashed lines indicate the eccentricities among all simulated planets, whereas the eccentricity distributions of only the hypothetically observable planets are shown as solid lines. The lower panel confronts the eccentricity distribution of planets in stable 3-planet systems (purple) with 2-planet systems (red) in which one planet collided or got ejected. For comparison, the eccentricity distribution of observed exoplanets around stars with luminosities exceeding 5 L⊙ is shown as a black solid line in both panels.
Current usage metrics show cumulative count of Article Views (full-text article views including HTML views, PDF and ePub downloads, according to the available data) and Abstracts Views on Vision4Press platform.
Data correspond to usage on the plateform after 2015. The current usage metrics is available 48-96 hours after online publication and is updated daily on week days.
Initial download of the metrics may take a while.